
TL;DR:
- CBA shares currently trade near $160.90, about 10% below their April 2026 peak, amid macroeconomic and sector-wide pressures. Its elevated P/E ratio above 25x reflects high valuation risk in a slowing economy, with analyst sentiment largely bearish. The stock's valuation premium remains unjustified until earnings forecasts stabilize and P/E ratios compress toward more reasonable levels.
Commonwealth Bank of Australia (ASX: CBA) shares currently trade near $160.90 per share, with a 52-week range spanning from $146.98 to $192. Understanding the price of Commonwealth Bank shares requires more than reading a ticker. Valuation metrics like the price-to-earnings (P/E) ratio, earnings per share (EPS) forecasts, and analyst consensus ratings all shape whether that number represents fair value or a stretched premium. This guide breaks down every layer of CBA's current valuation so you can make a more informed trading decision.
What factors currently influence the price of Commonwealth Bank shares?

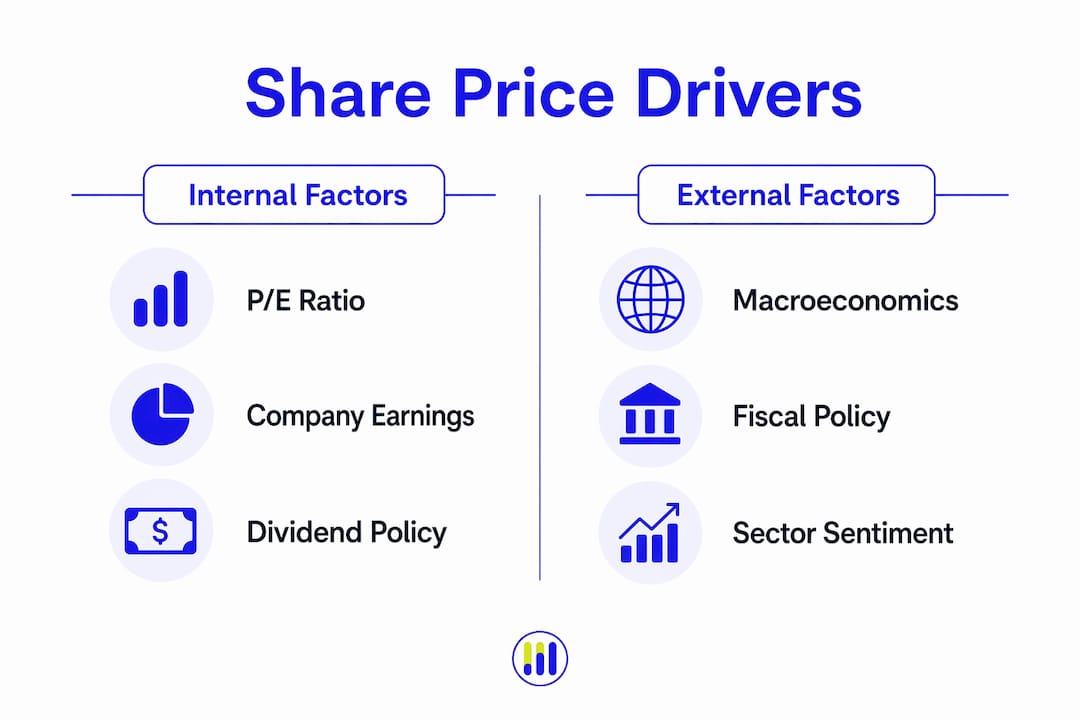
CBA's share price reflects a combination of macroeconomic pressures, fiscal policy shifts, and sector-wide analyst sentiment. No single factor explains the current level, but several converging forces have pushed the stock lower from its 2026 peak.
The May 2026 federal budget triggered a significant repricing event across the Australian banking sector. Major firms including Macquarie, Morgan Stanley, and JPMorgan all revised their CBA earnings forecasts downward after the budget announcement. That kind of coordinated downgrade signals that the market's prior expectations were built on assumptions the budget directly undermined.
The key drivers currently weighing on Commonwealth Bank's stock price include:
- Federal budget impact: Tax policy changes and fiscal measures reduced projected bank earnings, prompting forecast cuts across the sector.
- Slowing home loan demand: CBA's revenue is heavily tied to mortgage lending. A cooling Australian property market directly compresses net interest margins.
- Economic deceleration: Broader GDP softness reduces consumer borrowing, fee income, and overall bank profitability.
- Analyst downgrades: Revised earnings forecasts from multiple investment banks have reset price targets lower, pulling the market price with them.
- Dividend yield context: CBA's dividend yield near 3.00% is modest relative to its elevated P/E ratio, offering limited income compensation for the valuation risk.
CBA shares are now approximately 10% below their April 2026 peak. That correction is meaningful, but it does not automatically make the stock cheap. Price and value are different measures, and confusing them is the most common mistake individual investors make with blue-chip stocks.
Pro Tip: Track the ASX financial sector index alongside CBA to distinguish company-specific moves from broader sector rotations. If the whole sector falls, CBA's drop may reflect macro risk rather than a stock-specific problem.
How does the P/E ratio shape CBA's current valuation?
The price-to-earnings ratio is the most widely used measure of whether a stock is expensive or reasonably priced relative to its earnings. For CBA, this metric tells a cautionary story in 2026.
CBA's P/E ratio sits above 25x estimated FY26 earnings, based on an EPS forecast of approximately $6.48. That level is high for a mature bank operating in a slowing economy. Most global banking peers trade at significantly lower multiples, which means investors are paying a substantial premium for CBA's perceived quality and market dominance.
Forward-looking P/E ratios offer a more dynamic evaluation than trailing figures, particularly during economic transitions. Here is how to interpret CBA's valuation metrics step by step:
- Identify the forward EPS estimate. CBA's FY26 EPS is projected near $6.48. This is the denominator in the forward P/E calculation.
- Divide the current share price by forward EPS. At $160.90 divided by $6.48, the result is a P/E above 24x, confirming the elevated multiple.
- Compare to sector peers. Australian banking peers like ANZ, NAB, and Westpac typically trade at lower multiples, making CBA's premium visible and measurable.
- Assess earnings momentum. If EPS forecasts are being revised downward, as they were post-budget, the P/E ratio effectively rises even if the share price stays flat.
- Weigh the risk premium. A P/E above 25x in a decelerating economy means the market is pricing in continued earnings growth. Any shortfall against that expectation will pressure the stock further.
CBA's valuation remains stretched relative to earnings growth, even after the recent price correction. That is the core tension every investor must resolve before acting on the current price level.
Pro Tip: Use Tickerplace's CBA valuation tool to compare CBA's forward P/E against its five-year average and sector peers in real time, rather than relying on static published figures.
How does CBA's share price compare to other major Australian banks?
Comparing CBA to its ASX-listed peers, ANZ, NAB, and Westpac, reveals how much of a valuation premium the market assigns to Australia's largest bank by market capitalization. The comparison also clarifies whether the current price reflects CBA-specific risk or sector-wide pressure.
Fiscal policy and economic trends affect all major Australian banks simultaneously, but the magnitude of impact varies by balance sheet composition and loan book exposure. CBA's heavier weighting toward retail mortgages makes it more sensitive to housing market slowdowns than peers with larger business banking or institutional divisions.
| Bank | Approximate P/E (FY26) | Analyst Sentiment | Key Risk Factor |
|---|---|---|---|
| Commonwealth Bank (CBA) | ~25x | Predominantly sell | High valuation, slowing mortgages |
| ANZ | ~13x | Mixed | International exposure, capital requirements |
| NAB | ~14x | Neutral to mixed | Business lending, SME credit risk |
| Westpac | ~14x | Neutral | Operational costs, mortgage competition |
The table makes the valuation gap concrete. CBA trades at roughly double the P/E multiple of ANZ, NAB, and Westpac. That premium has historically been justified by CBA's superior return on equity, technology investment, and retail banking dominance. Whether that justification holds in a lower-growth environment is the central debate among analysts covering the sector in 2026.
For investors comparing where to allocate capital within Australian banking, the P/E disparity is a starting point, not a conclusion. Dividend yield, earnings stability, and balance sheet quality all factor into a complete comparative assessment. Tickerplace's detailed CBA financial data provides the underlying numbers to run that comparison yourself.
What should investors consider when evaluating CBA shares today?
Interpreting the current Commonwealth Bank stock price as a buying opportunity requires more than observing that the stock has fallen 10% from its peak. The following considerations form a disciplined evaluation framework:
- Analyst consensus is bearish. 14 out of 16 analysts currently hold sell or strong sell ratings on CBA, with consensus price targets implying 20 to 25% downside from current levels. That is not a contrarian signal to ignore.
- Price drops are not automatic buy signals. Investors frequently misread price declines as value creation. A stock that falls from an overvalued level to a slightly less overvalued level is still expensive.
- Monitor home loan data. CBA's earnings are directly linked to mortgage volumes and net interest margins. Monthly Australian Bureau of Statistics housing finance data is a leading indicator for CBA's revenue trajectory.
- Watch quarterly earnings releases. Quarterly results in the context of macroeconomic trends provide the most reliable signal of whether the bank's fundamentals are stabilizing or deteriorating further.
- Combine sentiment with fundamentals. Analyst ratings reflect current consensus, but earnings revisions, margin data, and loan growth figures tell you whether that consensus is likely to shift. Use both together.
For a deeper breakdown of CBA's 2026 price movements and fiscal policy impacts, Tickerplace's CBA share price analysis covers the post-budget environment in detail.
Key takeaways
CBA shares trade at a historically high P/E multiple above 25x in a slowing economy, making the current price a valuation risk rather than a clear buying opportunity despite the 10% correction from April 2026 highs.
| Point | Details |
|---|---|
| Current share price | CBA trades near $160.90, down roughly 10% from its April 2026 peak. |
| Elevated P/E ratio | A forward P/E above 25x signals a premium valuation relative to Australian banking peers. |
| Analyst consensus | 14 of 16 analysts rate CBA a sell, with targets implying 20 to 25% downside. |
| Key earnings driver | Home loan demand and net interest margins are the primary variables to monitor. |
| Peer comparison | ANZ, NAB, and Westpac trade near 13 to 14x forward earnings, roughly half CBA's multiple. |
Tickerplace's perspective on CBA's investment outlook
The numbers around CBA in mid-2026 present a genuinely difficult case. The stock has corrected meaningfully, the dividend yield is real, and the bank's underlying franchise remains among the strongest in the Asia-Pacific region. Those facts are not in dispute.
What concerns me is the persistence of the valuation premium at a moment when the earnings foundation supporting it is being actively revised lower. Government fiscal policies have a direct and outsized effect on banking sector forecasts, and the May 2026 budget demonstrated exactly how quickly that transmission can occur. When Macquarie, Morgan Stanley, and JPMorgan all move in the same direction within weeks of a budget announcement, that is not noise. That is a structural reassessment.
My practice is to treat a P/E above 22x for a large-cap bank as a threshold requiring exceptional earnings growth justification. CBA does not currently meet that bar given the forecast revisions. I watch for two things before reconsidering: a forward P/E that compresses toward 18 to 20x, and at least one quarterly earnings report showing stabilization in net interest margins. Until both conditions are met, the risk-reward calculus favors patience over conviction.
— Tickerplace
Track CBA shares with Tickerplace
Staying current on Commonwealth Bank's share price requires more than checking a number once a day. Price movements only become meaningful when you can contextualize them against earnings revisions, sector trends, and valuation benchmarks in real time.

Tickerplace provides real-time CBA stock data, forward P/E calculators, analyst rating summaries, and a stock screener that lets you filter ASX-listed banks by valuation metrics, dividend yield, and earnings momentum. Whether you are assessing entry points, monitoring your existing position, or comparing CBA against ANZ, NAB, and Westpac, Tickerplace gives you the data infrastructure to make that analysis rigorous rather than reactive. Start with the screener to build your own comparative view of the Australian banking sector today.
FAQ
What is the current price of CBA shares?
CBA shares trade near $160.90, with a 52-week range between $146.98 and $192. The stock is approximately 10% below its April 2026 peak following federal budget impacts and analyst forecast revisions.
Is CBA a good buy at its current share price?
Most analysts do not consider CBA a buy at current levels. 14 out of 16 analysts hold sell or strong sell ratings, with consensus price targets implying 20 to 25% downside from the current Commonwealth Bank share value.
What is CBA's P/E ratio in 2026?
CBA's forward P/E ratio is above 25x based on estimated FY26 earnings per share of approximately $6.48. This is significantly higher than Australian banking peers ANZ, NAB, and Westpac, which trade near 13 to 14x forward earnings.
How do I buy Commonwealth Bank shares?
To buy Commonwealth Bank shares, you need a brokerage account with access to the Australian Securities Exchange (ASX), where CBA is listed under the ticker symbol CBA. Most online brokers offering ASX access allow direct share purchases.
What drives changes in the Commonwealth Bank Australia stock price?
CBA's stock price is primarily driven by earnings forecasts, home loan demand, net interest margin trends, and macroeconomic conditions including fiscal policy changes. Analyst rating revisions from firms like Macquarie and Morgan Stanley also move the price materially in the short term.