
TL;DR:
- Bank of Queensland's share price reflects its financial health, earnings, and dividend stability in the market. It trades below sector average based on PE ratios, indicating potential undervaluation, especially when accounting for franking credits. External macro factors like RBA interest rates and credit quality influence its short- and long-term share outlook.
Bank of Queensland's share price is the market's real-time valuation of the company's financial health, earnings capacity, and dividend reliability. The ASX-listed stock (ticker: BOQ) closed at A$6.20 on June 1, 2026, with a daily range of A$6.20 to A$6.28 and volume of approximately 1.43 million shares. For investors and analysts tracking the bank of QLD share price, that single data point is only the starting line. Understanding what drives it, how it compares to peers, and how to model its fair value is where the real work begins.
What financial factors drive the BOQ share price?
BOQ's share price responds directly to its earnings cycle, dividend declarations, and capital position. The half-year 2026 results showed revenue up 4% to $835 million alongside a 20% drop in statutory net profit to $136 million. That combination tells investors the bank is growing its top line while absorbing higher costs, a nuance the raw share price does not immediately communicate.
Several specific financial metrics move the stock in predictable ways:
- Earnings per share (EPS): BOQ's FY24 EPS of $0.41 anchors the price-earnings calculation. Any revision to forward EPS guidance shifts the stock quickly.
- Dividend stability: The bank maintained a fully franked interim dividend of 20 cents per share despite the profit decline. Dividend continuity signals management confidence and directly supports income-focused investors.
- Net interest margin (NIM): NIM rose to 1.67% in the half-year 2026 period. A widening NIM indicates the bank is earning more on loans relative to its funding costs, which is a direct profitability driver.
- CET1 capital ratio: The Common Equity Tier 1 ratio improved to 11.18%, above regulatory minimums. A higher CET1 ratio reduces the probability of a dividend cut and lowers perceived financial risk.
Pro Tip: Watch BOQ's half-year and full-year reporting dates closely. Analysts confirm that price reacts sharply around earnings releases, particularly when capital or liquidity disclosures diverge from consensus expectations.
How does BOQ's valuation compare with peer Australian banks?

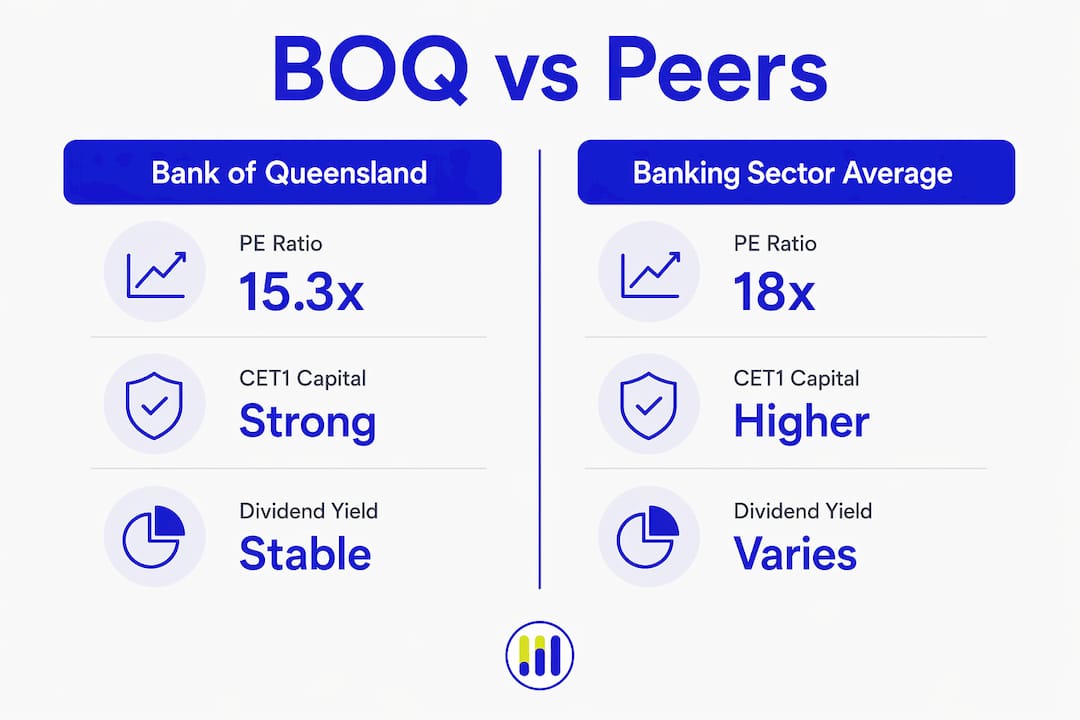
BOQ's valuation metrics sit below the sector average on most measures, which creates both an opportunity and a question worth examining carefully. The PE ratio based on FY24 EPS of $0.41 is approximately 15.3x, compared to the banking sector average of 18x. That 15% discount to peers suggests potential undervaluation, though it also reflects BOQ's smaller scale and lower earnings growth trajectory relative to the major four banks.
The table below benchmarks BOQ against key reference points for Australian bank investors:
| Metric | BOQ | Banking sector average |
|---|---|---|
| Price-earnings ratio | ~15.3x | ~18x |
| CET1 capital ratio | 11.18% | ~12–13% (major banks) |
| Half-year revenue growth | +4% | Varies by institution |
| 12-month price performance | Roughly flat | ASX 200 up ~15% |
BOQ shares have remained roughly flat over the past 12 months while the S&P/ASX 200 index rose approximately 15% in the same period. That underperformance relative to the broader index is a meaningful signal for investors weighing Bank of Queensland stock value against opportunity cost. For context on how a major bank compares, the ANZ share price has followed a materially different trajectory driven by its larger institutional lending book.
Market sentiment toward BOQ is also shaped by its regional bank positioning. Unlike Commonwealth Bank of Australia or Westpac, BOQ operates with a narrower geographic and product footprint, which concentrates both its risk and its upside to Queensland's economic conditions.
What valuation models work best for BOQ stock?
Applying a structured valuation framework to BOQ shares produces more reliable estimates than relying on price charts alone. Three approaches are most relevant for this stock:
-
Sector-adjusted PE valuation: Apply the sector average PE of 18x to BOQ's EPS of $0.41, which yields a fair value estimate of approximately $7.38 per share. At the current price of $6.20, this approach suggests the stock trades at a discount to intrinsic value.
-
Cash dividend discount model: Discount expected future cash dividends at a required rate of return. Using BOQ's 20-cent interim dividend as a base and annualizing, the cash-only model produces a conservative valuation that underestimates actual shareholder returns.
-
Gross dividend model incorporating franking credits: This is the most accurate approach for Australian investors. Modeling gross dividends including franking credits raises the valuation to approximately $10.57 per share using a forecast gross dividend of $0.50. That figure is 70% above the current market price, which illustrates how significantly franking credits affect the true yield calculation.
The table below summarizes the three valuation outputs:
| Valuation method | Key input | Estimated fair value |
|---|---|---|
| Sector PE (18x) | FY24 EPS $0.41 | ~$7.38 |
| Cash dividend discount | Annualized cash dividend | Conservative / below market |
| Gross dividend discount | Forecast gross dividend $0.50 | ~$10.57 |
Pro Tip: Incorporating franking credits into your dividend model is not optional for Australian resident investors. Ignoring them systematically understates the effective yield and leads to undervaluation of fully franked bank stocks like BOQ.
Every model carries limitations. Forward EPS estimates can be revised materially if credit losses rise or NIM compresses. Discount rate assumptions in dividend models are sensitive to interest rate expectations. Use multiple approaches and treat the output as a range, not a precise target.
What external factors shape the BOQ share price outlook?
Macroeconomic conditions set the ceiling and floor for where BOQ's stock can trade, regardless of company-specific performance. Several external forces are directly relevant to the Bank of QLD market trends in 2026:
- Reserve Bank of Australia (RBA) interest rate policy: Rate expectations directly affect NIM and credit demand. Employment data and geopolitical risks have recently reduced the probability of near-term rate hikes, which tempers the NIM expansion thesis for bank stocks.
- Unemployment rate: Rising unemployment increases the probability of loan defaults and higher provisioning costs. Any upward surprise in Australia's jobless rate weighs on bank sector sentiment broadly and on BOQ specifically given its Queensland concentration.
- Geopolitical risk: Events such as Middle East tensions affect global risk appetite and can trigger capital flows away from smaller regional bank equities toward perceived safe havens.
- Credit quality: BOQ's provisioning levels and arrears data, disclosed at each reporting period, signal whether the loan book is deteriorating. Investors should track these figures alongside the headline share price.
Short-term price drivers tend to cluster around reporting seasons and RBA meeting dates. Long-term drivers are dominated by earnings growth, dividend sustainability, and the bank's ability to compete for mortgage and business lending market share against the major four banks.
Key takeaways
BOQ's current share price of A$6.20 trades at a discount to both sector PE averages and gross dividend discount valuations, making franking credit modeling the most critical analytical step for Australian investors.
| Point | Details |
|---|---|
| Current price context | BOQ closed at A$6.20 on June 1, 2026, with a daily range of A$6.20 to A$6.28. |
| PE discount to sector | BOQ's PE of ~15.3x sits below the sector average of 18x, indicating potential undervaluation. |
| Franking credits matter | Gross dividend modeling raises fair value to ~$10.57, far above the cash-only estimate. |
| Underperformance vs. ASX 200 | BOQ shares were roughly flat over 12 months while the ASX 200 rose ~15%. |
| External rate risk | RBA policy and employment data remain the dominant short-term price catalysts for BOQ. |
Tickerplace's perspective on reading BOQ's share price correctly
The most common mistake investors make with BOQ is treating the share price as the whole story. A stock sitting at $6.20 looks cheap against a gross dividend valuation of $10.57, but that gap does not automatically make it a buy. The discount exists for a reason: statutory profit fell 20% in the most recent half, and the bank's scale disadvantage against Commonwealth Bank of Australia, Westpac, and NAB is structural, not cyclical.
What I find most underappreciated in BOQ analysis is the franking credit adjustment. Most retail investors look at the cash dividend yield and compare it to a term deposit rate. That comparison is incomplete. The gross yield, once franking credits are included, is materially higher and changes the risk-reward calculation significantly for Australian resident investors in the 30% to 45% tax bracket.
The other factor worth watching is the CET1 ratio at 11.18%. It is above the regulatory floor but below the buffers maintained by the major banks. Any deterioration in credit quality that forces additional provisioning could pressure that ratio and, with it, dividend sustainability. For investors holding BOQ for income, the BOQ financial statements are worth reviewing each reporting period, not just the headline dividend announcement.
Price alone misleads. Earnings reconciliation, gross dividend yield, and capital adequacy together tell the real story.
— Tickerplace
Track and analyze BOQ shares with Tickerplace
Monitoring the Bank of Queensland share price effectively requires more than a single price feed. Tickerplace provides real-time BOQ stock data including historical price charts, market capitalization, and trading volume, giving you the context to interpret daily price movements accurately.

The Tickerplace stock screener lets you filter and compare BOQ against other ASX-listed banks using metrics like PE ratio, dividend yield, and CET1 capital ratios, so you can benchmark the stock against its peers in seconds. For investors building a valuation model, Tickerplace's research tools support dividend discount calculations and financial statement analysis in one place. Whether you are tracking BOQ for an active trade or a long-term income position, Tickerplace gives you the data infrastructure to make that decision with confidence.
FAQ
What is the current BOQ share price?
BOQ closed at A$6.20 on June 1, 2026, with a daily trading range of A$6.20 to A$6.28 and volume of approximately 1.43 million shares.
What is BOQ's dividend yield and is it fully franked?
BOQ pays fully franked dividends, with a stable interim dividend of 20 cents per share declared in the half-year 2026 results. When franking credits are included, the gross dividend yield is materially higher than the cash yield alone.
How does BOQ's PE ratio compare to other Australian banks?
BOQ's PE ratio of approximately 15.3x based on FY24 EPS of $0.41 is below the banking sector average of 18x, suggesting the stock may trade at a discount to its intrinsic value relative to peers.
Why has BOQ underperformed the ASX 200?
BOQ shares remained roughly flat over the past 12 months while the S&P/ASX 200 rose approximately 15%, reflecting the bank's profit decline, smaller scale, and limited earnings growth compared to the major four Australian banks.
How do I buy Bank of QLD shares?
BOQ shares trade on the Australian Securities Exchange under the ticker BOQ and can be purchased through any ASX-registered broker or online trading platform that provides access to Australian equities.