
TL;DR:
- ANZ's share price is driven by macroeconomic factors, company results, and regulatory developments, making it highly unpredictable.
- Historical data reveals patterns in response to economic cycles, dividends, and support levels, aiding strategic analysis.
The ANZ share price sits at the intersection of macroeconomic forces, regulatory signals, and company-specific developments, making it one of the most closely watched equities on the Australian Securities Exchange (ASX). Even seasoned investors can find themselves caught off guard, since analysts can be split across buy/hold/sell with a wide implied range of upside and downside versus the current price. This guide walks through what actually moves ANZ's price, how to interpret its historical data, how it compares to peer banks, and how to use real-time information to invest with greater precision and confidence.
Key Takeaways
| Point | Details |
|---|---|
| Multiple factors at play | ANZ's share price is shaped by a mix of global markets, news events, and analyst opinions. |
| Benchmarking improves insight | Comparing ANZ to similar banks helps spot unique opportunities or risks. |
| History informs—but doesn't determine | Past price trends offer clues but shouldn't be the sole basis for decisions. |
| Consensus is not absolute | Diverging analyst forecasts mean investors must do their own due diligence. |
What drives the ANZ share price?
To understand the ANZ share price's unpredictability, it's essential to detail the forces that move it. ANZ Group Holdings Limited (ASX: ANZ) is one of Australia's four major banks, meaning its share price reflects not just company performance but the health of Australia's broader financial system. Several key forces are constantly in play.
Primary price drivers include:
- Earnings reports and financial results: Quarterly and half-year profit announcements frequently trigger sharp moves. A result that beats analyst forecasts, even modestly, can send the share price up by several percent within hours.
- Dividend announcements: ANZ's dividend yield is a core attraction for income investors. Changes to payout ratios or special dividends create immediate pricing reactions.
- Interest rate decisions: The Reserve Bank of Australia's (RBA) cash rate direction affects ANZ's net interest margin (the difference between what the bank earns on loans and pays on deposits). Rate hikes generally improve bank margins, while cuts compress them.
- Regulatory and compliance developments: APRA (Australian Prudential Regulation Authority) rulings on capital requirements, provisioning, or conduct issues are significant catalysts.
- Global credit conditions: Tightening in international wholesale funding markets raises borrowing costs for large banks, directly pressuring profitability and share price.
- Market sentiment: Broad risk-off periods, such as those triggered by geopolitical tensions or global economic slowdowns, often cause institutional investors to reduce exposure to financial sector equities.
"Analysts can be split across buy/hold/sell with a wide implied range of upside/downside versus the then-current price." — Motley Fool Australia, March 2026
This quote captures a critical truth: even with the same publicly available data, two analysts can reach diametrically opposite conclusions. One analyst's disciplined DCF (discounted cash flow) model might flag ANZ as overvalued, while another's relative valuation approach sees it as a bargain. Reviewing the ANZ financial statements directly allows you to form your own baseline before layering in analyst views.
Pro Tip: Don't wait for earnings season to check fundamentals. Monitor ANZ's quarterly updates, RBA meeting outcomes, and APRA announcements throughout the year to stay ahead of potential price inflection points.
Analyzing historical ANZ share price trends
After grasping what influences immediate price movement, let's examine what history reveals. Historical price data provides a roadmap of how ANZ has responded to past stress events, economic cycles, and corporate milestones. Studying this record is essential for identifying patterns that repeat with reasonable consistency.
Key steps for reading ANZ's historical price data:
- Identify macro cycle phases. ANZ's share price has generally risen during periods of credit expansion and fallen during financial stress events. The 2008 global financial crisis, the COVID-19 pandemic shock of March 2020, and the rate hike cycle beginning in 2022 each left clear marks on the price chart.
- Map dividends to price behavior. ANZ typically pays two dividends per year. The stock often trades with a modest premium in the weeks leading up to the ex-dividend date, then corrects afterward as income investors exit their positions.
- Look for support and resistance zones. Technical analysts (those who use price charts and trading volume to forecast price direction) note that ANZ's price has repeatedly found support near long-term moving averages. These levels can serve as meaningful reference points for entry timing.
- Compare to index performance. Measuring ANZ against the ASX 200 Financials sub-index reveals whether the stock is outperforming or lagging its sector peers.
| Period | Key event | Price impact |
|---|---|---|
| 2008 to 2009 | Global financial crisis | Significant decline, then recovery |
| 2020 (March) | COVID-19 market selloff | Sharp drop, dividend cut |
| 2022 to 2023 | RBA rate hike cycle | Margin expansion, price recovery |
| 2024 to 2025 | Suncorp Bank acquisition | Short-term uncertainty, long-term re-rating |
Tracking historical ANZ stock prices over these periods shows how the bank has consistently recovered from external shocks, though timing and magnitude vary. Combining this with a broader framework for analyzing share price trends adds additional technical rigor to your process.

Comparing ANZ with other major Australian banks
Once you understand ANZ's own pattern, the next step is to see how it stacks up against its sector. The Australian banking sector is dominated by four institutions, often called the "Big Four": ANZ, Commonwealth Bank of Australia (CBA), National Australia Bank (NAB), and Westpac. These banks share structural similarities but diverge meaningfully on strategy, market exposure, and recent execution.
Why comparison matters:
- During broad sector moves (such as a surprise RBA rate decision), all four banks may shift together, making relative performance the real differentiator.
- Company-specific news (a regulatory penalty, a bad debt provision, or a major acquisition) can cause one bank to sharply diverge from its peers.
- Valuation multiples (price-to-earnings ratio, or P/E; price-to-book ratio, or P/B) vary across the group. A lower P/E for ANZ compared to CBA may reflect lower growth expectations or higher perceived risk, not necessarily a buying opportunity on its own.
| Bank | Typical P/E range | Dividend yield focus | Recent strategic theme |
|---|---|---|---|
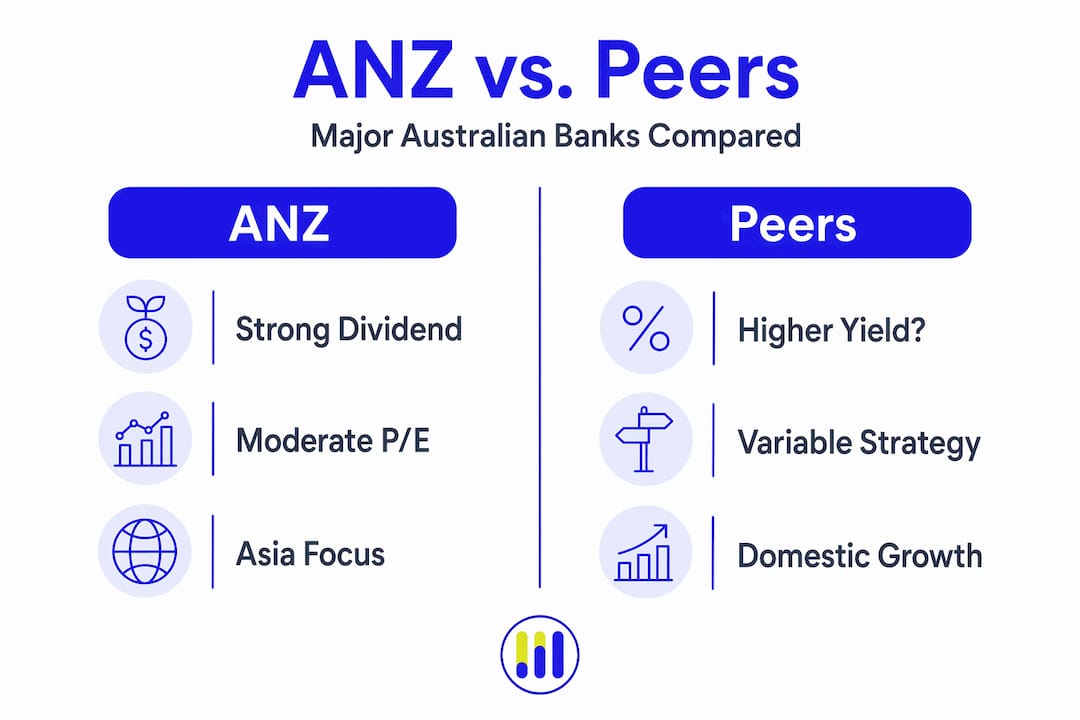
| ANZ | Moderate | High | Suncorp integration, Asia expansion |
| CBA | Premium | Moderate | Retail banking dominance |
| NAB | Moderate | High | Business banking growth |
| Westpac | Discount to peers | High | Operational simplification |
Checking ASX financials and NAB financials side by side with ANZ's data gives you a clear, data-driven basis for any relative value judgment. Scanning the full universe of ASX-listed stocks can also reveal sector rotation patterns that inform when to favor one bank over another.
As noted by analysts closely watching the space, expert opinions diverge significantly even within the same sector, and benchmarking ANZ against its peers provides a sharper lens than evaluating it in isolation.
How to use real-time ANZ share data for smarter investing
With both historical and relative context, you're ready to make actionable use of real-time ANZ data. Real-time pricing is not just a number; it's a live signal that reflects every piece of available information currently priced into the market. Used correctly, it sharpens both entry and exit decisions.
A practical framework for applying real-time data:
- Set price alerts at technical levels. Rather than checking the price obsessively, configure alerts at key support and resistance prices. This keeps you reactive to meaningful moves without inducing decision fatigue.
- Monitor volume alongside price. A price move on unusually high volume (total shares traded in a session) carries more conviction than the same move on thin volume. High-volume moves often signal institutional activity.
- Cross-reference real-time price with upcoming catalysts. If an RBA meeting or ANZ's earnings date is imminent, a near-term price spike may be short-lived. Adjust your position sizing accordingly.
- Avoid chasing intraday spikes on news rumors. Rumors trigger exaggerated moves. Waiting 30 to 60 minutes after a major headline often reveals the genuine market reaction.
- Use the bid/ask spread as a liquidity indicator. A tight spread on ANZ's shares confirms deep market liquidity; a wider spread signals caution about execution costs.
Pro Tip: Access real-time ANZ share data from a platform that aggregates both price feeds and fundamental data in one place, so you're not flipping between multiple tools when time-sensitive decisions arise.
Analyst consensus on ANZ shifts with each new report, so real-time data keeps your analysis current rather than anchored to stale forecasts.
Why following consensus alone can be risky: An expert viewpoint
With practical tactics laid out, let's challenge one of the most common pitfalls for investors: treating consensus analyst ratings as a reliable signal. Consensus, by definition, represents an average of diverse opinions. The problem is that it can mask a wide range of individual forecasts, some radically bullish and some deeply bearish, beneath a single label like "moderate buy."
When expert views diverge sharply, a consensus rating can create false confidence. An investor who reads "analysts rate ANZ a buy" may not realize that the distribution behind that consensus includes multiple analysts with strong sell ratings. That hidden disagreement signals genuine uncertainty, not alignment.
The same applies to following price trends blindly. A six-month uptrend in ANZ's share price can reverse quickly when a single undisclosed risk (an elevated loan book exposure to a stressed sector, for example) surfaces in a results announcement. Investors who rode the trend without examining the underlying investor insights are often the most exposed when the correction arrives.
The better approach combines three disciplines: read the consensus but map its full distribution; verify the thesis using primary sources (ANZ's own financial disclosures, RBA data, APRA guidelines); and maintain a checklist of risks that would invalidate your investment case. This multi-angle discipline is more demanding than majority-rules investing, but it consistently yields clearer decisions and fewer costly surprises.
Leverage the right tools for deeper ANZ analysis
When you're ready to take your next step, specialized platforms can make all the difference. Conducting rigorous ANZ research requires more than a basic price chart. You need screening capabilities, comparative data, and fundamental metrics in one streamlined environment.

Tickerplace gives investors and analysts direct access to real-time price data, technical overlays, and fundamental analysis tools designed for serious market participants. Use the stock screener to filter ASX financial stocks by valuation, yield, or momentum criteria, then drill into ANZ-specific metrics for side-by-side comparison. The investing education center supports ongoing learning as market conditions evolve. Whether you're building a long-term income position or evaluating a tactical trade, Tickerplace provides the data infrastructure to support well-reasoned decisions.
Frequently asked questions
What is the best way to track the ANZ share price in real time?
Use reputable stock market platforms and brokerages that offer up-to-the-minute data, including direct feeds from ASX listings. Platforms that combine live pricing with fundamental analysis provide the most complete picture.
Why do analyst ratings for ANZ shares differ so much?
Because expert forecasts depend on differing financial models, risk tolerances, and market perceptions, there can be striking disagreement between buy, hold, or sell ratings. As noted in recent analysis, analysts can sit across the full spectrum even when reviewing identical financial data.
How important is it to compare ANZ's share price with other major banks?
Comparing against peer banks is vital for context since sector-wide events often move the group together while company-specific news drives divergence; without this comparison, relative value and risk signals are easy to miss.
Can you rely on historical ANZ share prices to predict future returns?
Past performance helps identify trends and behavioral patterns during recurring macro events, but it should be only one component of a broader decision-making toolkit that includes current fundamentals and forward-looking indicators.