TL;DR:
- CBA’s share price experienced significant volatility in 2026, driven by economic uncertainties, rising loan impairments, and rate sensitivities. Despite a strong business lending growth and high valuation multiples, investors should carefully monitor macroeconomic factors and technical signals before committing. The stock remains a defensive core, but its premium valuation requires cautious position sizing amid near-term margin pressures and elevated risk factors.
Few stocks command the attention of Australian investors quite like Commonwealth Bank. The CBA share price ASX watchers track daily sits at A$160.74 as of May 19, 2026, well below its 52-week high of A$192.00. That gap tells a story worth understanding before you make your next move. This article breaks down what drove 2026’s sharp volatility, how CBA’s valuation compares to peers, and what practical steps investors and traders should consider when analyzing this stock.
Key takeaways
| Point | Details |
|---|---|
| Recent price crash | CBA shares dropped over 10% in a single day on May 13, 2026, exposing valuation risk. |
| Solid but slowing profit | FY26 Q3 profit grew 4% year on year, though business lending momentum remains strong. |
| Premium valuation persists | CBA trades at a P/E ratio near 25, well above major peers, signaling high growth expectations. |
| Rate sensitivity is real | RBA interest rate decisions directly shape CBA’s mortgage volumes and net interest margins. |
| Defensive but not risk-free | CBA remains a core portfolio holding for many investors, though margin pressure is a genuine concern. |
CBA share price on the ASX: current status and recent performance
The 52-week trading range for CBA spans A$146.98 to A$192.00, a spread that reflects just how much sentiment has shifted in 2026. With a market capitalization of approximately A$268.8 billion, Commonwealth Bank remains the largest company on the ASX by market cap, a position that makes its price movements consequential for the broader index.

From a profitability standpoint, CBA delivered a FY26 Q3 profit of A$2.7 billion, up 4% on the prior corresponding period, though down 1% from the first half of FY26. Business lending was a genuine bright spot, growing 12.5% to A$21.6 billion and outperforming the broader loan system by 1.2x.
The headline numbers tell a more turbulent story on the trading side:
-
Single-day crash: On May 13, 2026, CBA shares fell 10.43%, dropping from A$171.57 to A$153.67 in one session.
-
Weekly and monthly declines: The stock fell 12.7% over the week of the crash and recorded a 14.8% monthly decline through mid-May 2026.
-
Loan impairment provisions: Quarterly impairments reached A$316 million, with a A$200 million increase in collective provisions flagged by management.
Those figures are worth sitting with. A bank generating solid profits while simultaneously raising loan loss provisions presents a nuanced picture, and that nuance is exactly where investment decisions get made.
Key factors driving CBA’s 2026 price moves
Understanding the CBA share price trend requires looking beyond the income statement. Several interconnected forces shaped the volatility investors experienced in 2026.
-
Interest rate sensitivity: CBA’s performance is closely tied to RBA monetary policy. Rate cuts can lift lending volumes but simultaneously compress net interest margins and raise the risk of bad debts as borrower behavior changes.
-
Geopolitical and economic risk: Management explicitly cited rising global uncertainty as a driver of the A$200 million increase in collective provisions during Q3 FY26. Investor confidence is difficult to maintain when the macroeconomic backdrop is unsettled.
-
Loan impairments: Quarterly impairments totaling A$316 million indicate that credit quality risks are no longer theoretical. Investors who had priced CBA for near-perfection were caught off guard.
-
Operating cost growth: Tech investments in cloud and AI pushed operating expenses up 1% in Q3 FY26. If the productivity benefits from these investments materialize slowly, margin pressure will persist.
-
Mortgage market competition: Intense competition among Australian banks for home loan market share continues to squeeze net interest margins, limiting the upside on CBA’s core revenue driver.
Pro Tip: Monitor RBA meeting dates and forward guidance closely. CBA’s share price has historically moved significantly in the days surrounding rate decisions, making these events material for both short-term traders and longer-term position holders.
CBA valuation compared to ASX banking peers
Valuation context is where many investors either gain an edge or walk into a trap. CBA does not trade like a mature, slow-growth bank. Its current metrics reflect a market pricing in outcomes that require near-perfect execution.
CBA’s price-to-earnings ratio sits near 25 as of May 2026, compared to NAB’s approximately 18. Its price-to-book ratio of roughly 3.8 also exceeds peer averages by a meaningful margin. The table below illustrates this gap clearly.
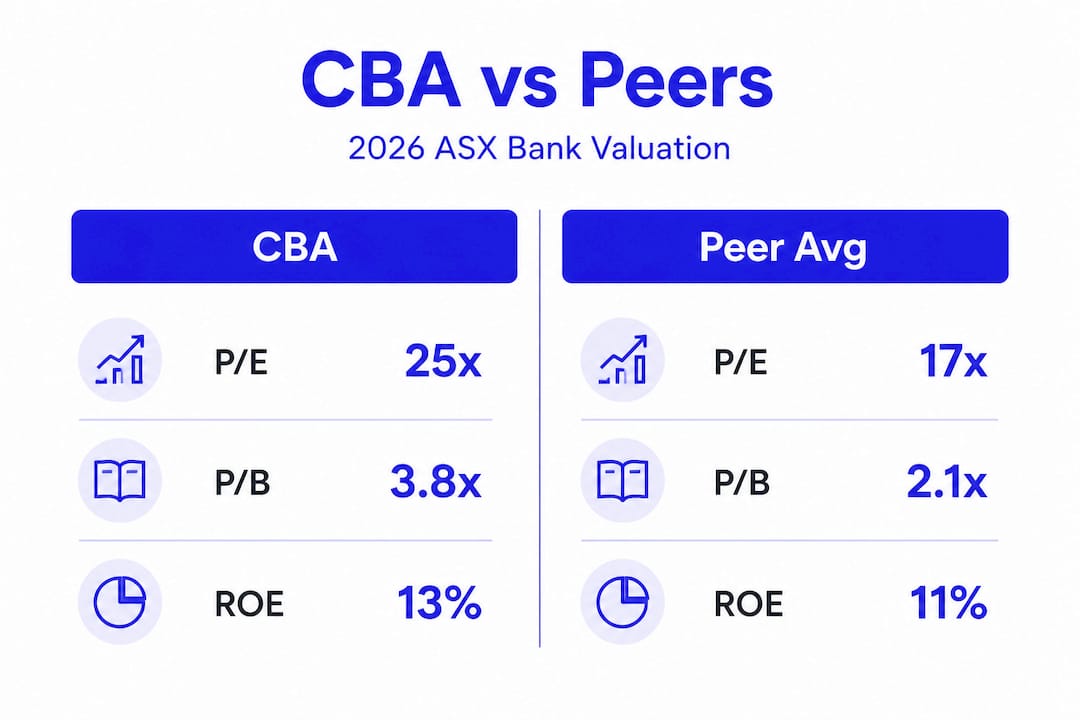
| Metric | CBA | NAB | Peer Average (est.) |
|---|---|---|---|
| P/E Ratio (May 2026) | ~25x | ~18x | ~17x |
| Price-to-Book Ratio | ~3.8x | ~1.9x | ~1.8x |
| Market Cap (A$ billion) | ~268.8 | ~110 | Varies |
| Business Lending Growth | 12.5% | N/A | N/A |
The premium CBA commands is not irrational on its face. Brand strength, customer franchise depth, and technology investment create genuine competitive advantages. However, high P/E ratios relative to peers signal that the market is pricing in growth that may be difficult to fully achieve given CBA’s already dominant market position and intensifying competition.
You can explore a more detailed breakdown of whether CBA’s current pricing reflects fair value at Tickerplace’s CBA valuation analysis.
Pro Tip: When comparing bank stocks by P/E, also check the return on equity and payout ratio. A high P/E paired with a high payout ratio limits the reinvestment capacity that would justify premium growth expectations.
Practical insights for analyzing CBA’s ASX price
Trading or investing in CBA requires more than watching the price chart. Here is a structured approach to interpreting the signals that matter most.
-
Read profit updates carefully. CBA’s Q3 FY26 result was broadly positive on profit and business lending but contained forward-looking provisions that spooked the market. Headline profit figures often obscure the directional signals embedded in management commentary.
-
Track macro risk indicators alongside the stock. CBA’s sensitivity to RBA policy means you should monitor monetary policy signals and inflation data as part of your CBA ASX analysis, not as background noise.
-
Use technical levels as context, not gospel. After the May 2026 crash, A$153.67 established a near-term support level. Trading volume on high-volatility days provides important confirmation of whether a move reflects broad institutional sentiment or thin-market noise.
-
Avoid overreacting to single-day moves. The 10.43% one-day drop was jarring, but CBA’s defensive portfolio role means capitulating at the low often means selling the defensive quality you originally bought. Assess whether the fundamentals changed, not just the price.
-
Review the CBA financial statements on a quarterly basis. Impairment provisions, operating cost trends, and lending growth rates are leading indicators of where the CBA share price trend heads next.
Pro Tip: Set price alerts at key technical levels rather than monitoring tick-by-tick. This reduces emotional decision-making during volatile sessions and keeps your analysis grounded in pre-defined criteria.
My perspective on CBA’s 2026 investment case
I’ve watched CBA trade at a premium to peers for years, and for most of that time, the premium felt justified. What 2026 revealed is that premium valuations have a fragile edge when conditions shift even slightly.
In my view, the May crash was not just a volatility event. It was a reassessment. Investors who held CBA as a growth stock received an uncomfortable reminder that it is, at its core, a mature financial institution operating in a competitive, regulation-heavy market. The strong business lending numbers are encouraging, but rising loan impairment provisions and tech cost pressures tell a more complicated story about the near-term margin outlook.
That said, I would not dismiss CBA as a portfolio holding. Its brand, capital ratios, and systemic importance in Australian banking give it genuine defensive characteristics that most growth stocks simply cannot offer. My caution is directed at the price paid, not the business itself. Buying CBA at a P/E of 25x with margin headwinds in both directions requires conviction that current market pricing fairly reflects those risks. Right now, I think it does not fully account for them. Position sizing and patience matter more here than they have in previous years.
— Tickerplace
Track CBA and ASX stocks with Tickerplace

Staying ahead of the CBA share price ASX movement requires more than periodic news checks. Tickerplace gives you access to real-time stock data, technical and fundamental analysis tools, and a stock screener built for serious market participants. Whether you are monitoring CBA’s quarterly financials, comparing its valuation to ASX peers, or screening for opportunities across the Australian market, Tickerplace brings the data and research tools you need into one place. Smarter investment decisions start with better information, and that is exactly what the platform is built to deliver.
FAQ
What is the current CBA share price on the ASX?
As of May 19, 2026, the CBA stock current price is A$160.74, with a 52-week range of A$146.98 to A$192.00 and a market capitalization near A$268.8 billion.
Why did the CBA share price drop sharply in May 2026?
CBA shares fell 10.43% on May 13, 2026, driven by rising economic and geopolitical concerns, a A$200 million increase in collective loan impairment provisions, and investor reassessment of the stock’s premium valuation relative to earnings growth.
Is CBA overvalued compared to other ASX bank stocks?
CBA trades at a P/E ratio near 25x versus NAB’s approximately 18x and carries a price-to-book ratio of roughly 3.8x, both significantly above peer averages. This suggests the market is pricing in growth expectations that may be difficult to sustain given competitive and regulatory pressures.
How do RBA interest rate decisions affect the CBA share price?
Rate cuts from the Reserve Bank of Australia can increase mortgage lending volumes for CBA, but they also compress net interest margins and may elevate bad debt risks, creating a mixed effect on profitability and the share price trend.
Is CBA a good stock for a defensive portfolio?
Market participants broadly view CBA as a defensive core holding due to its strong capital ratios and brand position in Australian banking. However, ongoing margin pressure from competition and rising loan impairments mean it carries more near-term risk than its defensive reputation alone might suggest.