
TL;DR:
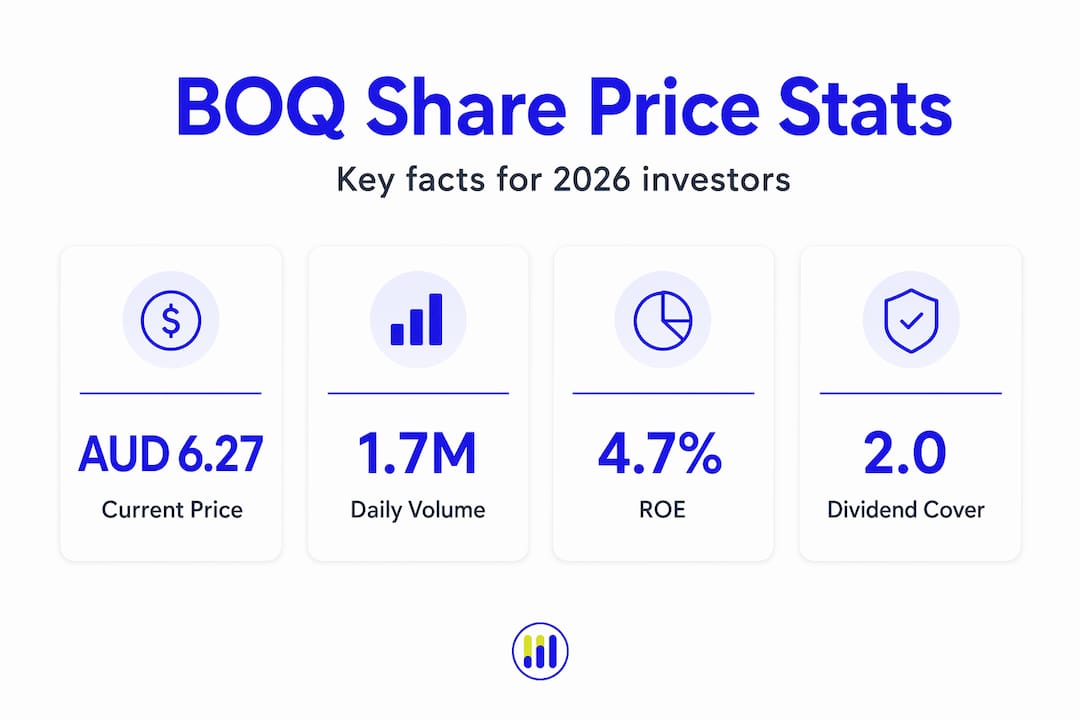
- The BOQ share price as of May 20, 2026, was around AUD 6.27, reflecting recent underperformance and a sector discount.
- Understanding BOQ's valuation requires examining dividend franking credits, net interest margins, and sector-specific financial metrics beyond just the stock price.
The BOQ shares price tells only part of the investment story. As of May 20, 2026, Bank of Queensland shares traded around AUD 6.27, with a daily range of AUD 6.26 to AUD 6.40. Many investors look at that number and stop there, which is a mistake. BOQ's valuation involves dividend franking credits, capital ratios, and a business model unlike Australia's major banks. This article unpacks what the current BOQ price actually reflects and how to use that data to make a better-informed decision.
Key takeaways
| Point | Details |
|---|---|
| Current BOQ price context | BOQ shares traded near AUD 6.27 on May 20, 2026, within a tight daily range. |
| Multi-year underperformance | BOQ has declined roughly 16% over one year and 28% over five years, lagging most peers. |
| Valuation discount exists | A P/E ratio of 15.1x sits below the sector average of 18x, suggesting a possible discount. |
| Dividends add hidden value | Fully franked dividends improve after-tax returns significantly for Australian tax residents. |
| DDM suggests upside range | Dividend discount model estimates place fair value between AUD 7.19 and AUD 10.57. |
BOQ share price history and recent trends
Understanding where the current BOQ stock price sits requires context. The stock has endured a prolonged period of underperformance, with a 1-year decline of roughly 16% and a 5-year decline of approximately 28%. Those figures put BOQ well behind many of its regional and major bank peers on the ASX.
The table below summarizes recent BOQ share price range and volume data to give you a practical baseline.
| Metric | Value |
|---|---|
| Current price (May 20, 2026) | AUD 6.27 |
| Daily range | AUD 6.26 to AUD 6.40 |
| 52-week performance | Down approximately 16% |
| 5-year performance | Down approximately 28% |
| Average daily volume | ~1.7 million shares |
The 52-week low is particularly significant for investors watching momentum indicators. When a stock sets new multi-year lows, it often reflects a combination of structural business challenges and broader sector headwinds rather than short-term noise. For BOQ, margin compression, rising operating costs, and stiff competition from the major four banks have each contributed to this sustained pressure.
Daily trading volume around 1.7 million shares indicates adequate liquidity for most individual investors, though it is worth noting this is modest compared to major Australian banks, which can trade tens of millions of shares daily.
Pro Tip: When evaluating BOQ share price history, always compare against both a sector index and a direct peer such as Bendigo and Adelaide Bank to isolate whether underperformance is bank-specific or industry-wide.
Key financial metrics behind BOQ's valuation
Price alone cannot tell you whether Bank of Queensland shares are cheap or expensive. Four metrics carry the most weight for a bank stock like BOQ.
BOQ's P/E ratio sits at approximately 15.1x, calculated from FY24 earnings per share of AUD 0.41. The banking sector average hovers near 18x, which means BOQ trades at a meaningful discount. A lower P/E can signal undervaluation, but it can also reflect lower growth expectations or elevated risk. Context matters.

Net interest margin (NIM) is the spread between what a bank earns on loans and pays on deposits, and it is the primary driver of bank profitability. BOQ's NIM stands at 1.56%, below the sector average of 1.78%. That gap directly suppresses earnings potential relative to peers and partly explains the discount in the current BOQ price.
| Metric | BOQ | Sector Average |
|---|---|---|
| P/E ratio | 15.1x | ~18x |
| Net interest margin (NIM) | 1.56% | 1.78% |
| Return on equity (ROE) | 4.7% | ~9.35% |
| CET1 capital ratio | 10.7% | Sector avg. higher |
The return on equity figure is sobering. At 4.7% against a sector average of roughly 9.35%, BOQ is generating significantly less profit per dollar of shareholder equity. A bank's CET1 capital ratio reflects its financial buffer against losses; BOQ's 10.7% CET1 sits below peers, which limits its capacity to absorb credit shocks without diluting shareholders.
Pro Tip: When comparing BOQ's financial ratios against sector averages, use Tickerplace's BOQ financials page to access up-to-date figures and run side-by-side comparisons with ASX-listed peers.
Dividend analysis and BOQ share valuation
Dividends are where BOQ's investment case gets more interesting. The bank pays dividends twice yearly, and those payments are generally fully franked. For Australian tax residents, fully franked dividends carry imputation credits that reduce the tax payable on dividend income, which materially improves after-tax yield compared to the headline number.
To understand just how much franking credits matter, consider this: fully franked dividends offer tax advantages that can add the equivalent of several percentage points to your effective yield, depending on your marginal tax rate. Investors and analysts who evaluate only the cash dividend without accounting for franking credits routinely underestimate the real return.
The dividend discount model (DDM) provides one structured way to translate dividend income into a fair value estimate. Here is how to apply it to BOQ:
- Identify the annual dividend. Use BOQ's most recent total annual dividend per share as your base input.
- Adjust for franking credits. Add the grossed-up value of franking credits to reflect the full pre-tax return.
- Choose a discount rate. This is typically your required rate of return, which should reflect BOQ's risk profile relative to the broader market.
- Apply a growth assumption. A conservative scenario might assume zero to modest long-term dividend growth.
- Calculate fair value. Divide the adjusted annual dividend by the difference between the discount rate and the assumed growth rate.
Using this framework, DDM valuations for BOQ range from approximately AUD 7.19 to AUD 10.57 depending on assumptions. At the current price of AUD 6.27, even the most conservative scenario suggests the market may be pricing in significant pessimism. The key word there is "may." DDM outputs are only as reliable as the inputs, and a bank that continues to compress its NIM and ROE may not sustain current dividend levels indefinitely.
Dividend cover is approximately 2.0, meaning earnings are roughly double the dividend paid. That provides a reasonable safety margin, though it deserves ongoing monitoring given the earnings pressure BOQ faces.
BOQ's market position and competitive context
BOQ operates nearly 200 branches under a largely owner-manager model, differentiating it structurally from the major four Australian banks. This model can drive customer service quality and local accountability, but it also creates scalability limits that weigh on efficiency ratios over time.
When you place the current BOQ stock price within the broader competitive picture, several factors stand out:
- BOQ competes primarily in the mortgage market, where the major banks hold substantial pricing power and lower funding costs.
- Competition from digital lenders has further compressed margins in the very segments where BOQ has historically been strongest.
- The owner-manager branch model, while a differentiator in service quality, limits the operational efficiency gains that larger banks achieve through centralized technology platforms.
- Analyst price targets average near AUD 6.46 over the next 12 months, implying modest upside from current levels but no strong consensus for a significant re-rating.
For investors comparing BOQ against ASX-listed peers, the picture is one of a structurally challenged regional bank trading at a discount that reflects real business risk, not merely market pessimism.
My perspective on reading the BOQ shares price
In my experience watching bank stocks on the ASX, the biggest mistake individual investors make with BOQ is treating the share price as either a bargain signal or a red flag in isolation. I've seen the same pattern repeatedly: a low P/E and a high dividend yield attract income-focused investors, who then find that a declining ROE erodes the thesis over time.
What I find most underappreciated is the franking credit angle. When you evaluate both cash dividends and franking credits as separate line items, you often find that BOQ's real yield to an Australian tax resident is considerably higher than it appears. That does not make it a buy, but it does mean the comparison with gross-paying alternatives is rarely apples to apples.
My honest view is that BOQ's discount to the sector is at least partly justified by its NIM compression and ROE gap. But the DDM range suggests the market may have overshot on pessimism. The right approach is to build a range of scenarios, stress-test the dividend assumptions, and size your position accordingly.
— Tickerplace
Track BOQ shares with Tickerplace

Tickerplace gives you the tools to move well beyond headline price. The platform provides real-time BOQ stock price data, full financial statement access, and side-by-side metric comparisons across the ASX banking sector. Whether you are screening for income stocks using dividend yield and franking status or running a valuation check on P/E and NIM, Tickerplace centralizes that data in one place. Visit Tickerplace to explore the stock research and screening tools, or use the stock screener to filter ASX-listed banks by the metrics that matter most to your investment criteria.
FAQ
What is the current BOQ share price?
As of May 20, 2026, the BOQ shares price was approximately AUD 6.27, with a daily trading range of AUD 6.26 to AUD 6.40.
How has BOQ share price performed over five years?
BOQ's five-year share price performance reflects a decline of roughly 28%, significantly underperforming many of its ASX banking peers.
Are BOQ dividends fully franked?
Yes, BOQ pays dividends twice yearly and they are generally fully franked, which provides meaningful tax advantages for eligible Australian investors.
How do analysts value the BOQ share price?
Analysts use metrics including P/E ratio, NIM, and DDM models; current analyst price targets average near AUD 6.46, while DDM-based fair value estimates range from AUD 7.19 to AUD 10.57.
How to buy BOQ shares?
You can buy Bank of Queensland shares through any ASX-accredited broker or online trading platform by searching for the ticker BOQ; reviewing the company's financial metrics on platforms like Tickerplace before purchasing helps you assess whether the current price aligns with your investment criteria.