Many investors assume blue chip stocks guarantee profits simply because they’re famous companies. That’s a costly misconception. While these stocks represent established, financially strong corporations with proven track records, they’re not immune to market forces or poor management decisions. Understanding what truly defines a blue chip stock, how to evaluate them properly, and where they fit in your portfolio separates informed investors from those chasing brand names. This guide reveals the characteristics that matter, practical evaluation methods, and strategies to leverage blue chip stocks for long-term portfolio stability.
Key Takeaways
| Point | Details |
|---|---|
| Definition and traits | Blue chip stocks are shares of large, reputable companies with decades of success and strong balance sheets that tend to dominate their industries and weather downturns better than smaller peers. |
| Dividends and stability | They offer steady dividend payments often rising over time and provide lower volatility for long term investors, though they are not risk free. |
| Evaluation criteria | Look for profitability across cycles, low debt levels, ample cash reserves, a long dividend growth history, investment grade ratings, and leading positions in essential industries. |
| Portfolio role | Blue chips appeal to long term investors seeking stability and can act as safe harbors during downturns, though diversification remains essential. |
Defining blue chip stocks: characteristics and significance
Blue chip stocks are shares of large, reputable companies with decades of operational success and financial stability. The term originated from poker, where blue chips hold the highest value. These corporations typically dominate their industries, maintain strong balance sheets, and weather economic downturns better than smaller competitors.
Several defining characteristics separate blue chip stocks from other equities. Market capitalization typically exceeds $10 billion, placing them in the large-cap category. They demonstrate consistent profitability across multiple business cycles, not just during bull markets. Financial strength shows in low debt-to-equity ratios and substantial cash reserves. Most importantly, they maintain dividend payment histories spanning decades, often increasing payouts annually even during recessions.
These stocks attract long-term investors seeking stability over explosive growth. Their established market positions and diversified revenue streams reduce volatility compared to smaller companies. When market turbulence hits, institutional investors and retirement funds gravitate toward blue chips as safe harbors. This consistent demand supports stock prices during downturns, though it doesn’t eliminate risk entirely.
Key characteristics include:
-
Market capitalization above $10 billion with global brand recognition
-
Dividend payments maintained for 25+ years with regular increases
-
Investment-grade credit ratings from major agencies
-
Leadership positions in mature, essential industries
-
Proven management teams with transparent governance
Understanding these traits helps you evaluate whether a stock truly qualifies as blue chip or simply carries a famous name. For deeper insights into investment fundamentals, examining financial statements and competitive positioning reveals the substance behind the reputation.
Examples of blue chip stocks across major markets
Concrete examples clarify what blue chip status looks like in practice. Companies like Apple, Johnson & Johnson, and Dow Inc. exemplify the characteristics discussed above, each dominating their respective sectors with decades of consistent performance.

In US markets, technology giants like Microsoft and Apple lead with market caps exceeding $2 trillion. Their products integrate into billions of lives globally, creating recurring revenue streams and pricing power. Financial institutions such as JPMorgan Chase and Visa process trillions in transactions annually, benefiting from economic growth without manufacturing physical products. Consumer goods leaders like Procter & Gamble and Coca-Cola maintain brand portfolios that span generations, ensuring stable demand regardless of economic conditions.
Australian markets feature their own blue chip leaders. Commonwealth Bank dominates banking with comprehensive financial services across the Asia-Pacific region. BHP Group leads global mining operations, supplying essential materials to manufacturing economies. Woolworths Group controls significant grocery market share, providing recession-resistant consumer staples.
Sector diversity among blue chips offers natural portfolio balance:
-
Technology: Microsoft, Apple, IBM
-
Healthcare: Johnson & Johnson, Pfizer, UnitedHealth
-
Finance: JPMorgan Chase, Visa, Berkshire Hathaway
-
Consumer goods: Procter & Gamble, Coca-Cola, Walmart
-
Industrial: 3M, Caterpillar, Honeywell
| Company | Exchange | Sector | Market Cap Range | Dividend History |
|---|---|---|---|---|
| Apple | NASDAQ | Technology | $2T+ | 12+ years |
| Johnson & Johnson | NYSE | Healthcare | $400B+ | 60+ years |
| Commonwealth Bank | ASX | Finance | $150B+ | 25+ years |
| Coca-Cola | NYSE | Consumer | $250B+ | 60+ years |
| Microsoft | NASDAQ | Technology | $2T+ | 20+ years |
These examples demonstrate that blue chip stocks span industries and geographies. Exploring NYSE blue chip stocks, NASDAQ blue chip stocks, or ASX blue chip stocks reveals hundreds of candidates meeting core criteria, though not all deserve equal consideration for your portfolio.
How to evaluate and invest in blue chip stocks effectively
Identifying blue chip stocks requires more than recognizing famous brands. Systematic evaluation separates companies with genuine strength from those coasting on past reputation. Start with quantitative metrics that reveal financial health and shareholder returns.
Market capitalization confirms the company operates at scale, typically above $10 billion. Price-to-earnings ratios indicate whether current valuations reflect earnings power, with ratios between 15-25 suggesting reasonable pricing for stable companies. Dividend payout consistency and financial health matter enormously, look for payout ratios between 40-60% of earnings, leaving room for growth while rewarding shareholders. Debt-to-equity ratios below 0.5 indicate conservative leverage that won’t threaten operations during credit crunches.
Critical evaluation metrics:
-
Market cap: Minimum $10B, preferably $50B+ for true blue chip status
-
P/E ratio: Compare to industry peers and historical averages
-
Dividend yield: 2-4% typical, with 25+ year payment history
-
Payout ratio: 40-60% sustainable, below 40% conservative, above 70% risky
-
Debt-to-equity: Below 0.5 excellent, 0.5-1.0 acceptable, above 1.0 concerning
-
Return on equity: Above 15% indicates efficient capital use
| Evaluation Factor | Blue Chip Standard | Why It Matters |
|---|---|---|
| Dividend growth | 5-10% annually | Demonstrates earnings power and management confidence |
| Free cash flow | Consistently positive | Funds dividends and growth without borrowing |
| Revenue stability | Less than 10% variance | Reduces earnings volatility and forecast uncertainty |
| Market share | Top 3 in industry | Indicates competitive advantages and pricing power |
Pro Tip: Monitor dividend payout trends over five years, not just current yield. Companies that steadily increase dividends during recessions demonstrate financial resilience that matters more than high yields that might get cut during downturns.
Investing strategies depend on your goals and timeline. Dollar-cost averaging into blue chips reduces timing risk, particularly valuable given their typically higher share prices. Dividend reinvestment compounds returns significantly over decades, turning income into additional shares that generate more income. Rebalancing annually maintains target allocations as some positions outperform others.
Risk considerations remain essential despite blue chip stability. Industry disruption can erode even dominant companies, as demonstrated by former blue chips like General Electric declining due to management missteps and market changes. Overvaluation during bull markets creates downside risk when sentiment shifts. Geographic concentration exposes you to regional economic problems. Optimize your stock trading workflow by combining fundamental analysis with technical indicators and using stock screener tools to identify candidates meeting your specific criteria.
Comparing blue chip stocks with other stock types for portfolio balance
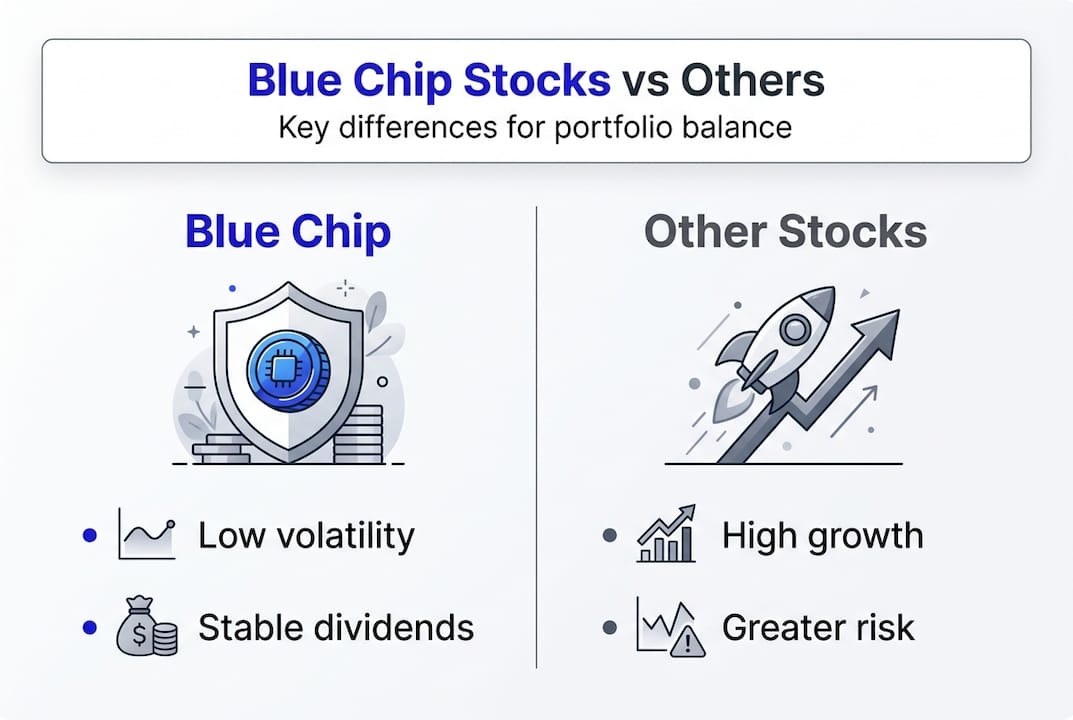
Understanding what sets blue chip stocks apart from other categories helps you construct balanced portfolios matching your risk tolerance and return objectives. Blue chip stocks are less volatile but typically have slower growth compared to small-cap or growth stocks, creating natural diversification opportunities.
| Stock Type | Volatility | Dividend Yield | Growth Potential | Risk Level |
|---|---|---|---|---|
| Blue Chip | Low | 2-4% | Moderate (5-8% annually) | Low to moderate |
| Growth Stock | High | 0-1% | High (15%+ annually) | Moderate to high |
| Small-Cap | Very high | 0-2% | Very high (20%+ potential) | High |
| Value Stock | Moderate | 3-5% | Moderate (7-10% annually) | Moderate |
Blue chip stocks provide portfolio stability through consistent earnings and dividends. Their lower volatility reduces dramatic portfolio swings, helping you sleep better during market turbulence. However, their mature market positions limit explosive growth potential. When technology shifts or consumer preferences change rapidly, these large organizations often adapt slowly, missing opportunities that nimble competitors capture.
Growth stocks offer the opposite profile. Companies like Tesla or emerging biotech firms prioritize revenue expansion over profitability, reinvesting all earnings into research and market penetration. This strategy can generate returns exceeding 20% annually during favorable periods but creates stomach-churning volatility. A single quarterly earnings miss might trigger 30% price drops, while positive news sends shares soaring.
Small-cap stocks present even higher risk-reward ratios. These companies operate in niche markets or emerging industries where success means 10x returns but failure means total loss. Their limited resources make them vulnerable to economic downturns, competitive pressure, and operational challenges. Yet their agility allows rapid adaptation to market changes that blue chips miss.
Portfolio integration strategies:
-
Conservative allocation: 70% blue chip, 20% value stocks, 10% growth stocks
-
Balanced allocation: 50% blue chip, 30% growth stocks, 20% small-cap stocks
-
Aggressive allocation: 30% blue chip, 50% growth stocks, 20% small-cap stocks
Pro Tip: Assess your risk tolerance honestly by imagining a 30% portfolio decline. If that scenario would cause you to sell everything in panic, increase your blue chip allocation until you can weather downturns without emotional decisions.
Combining these stock types creates synergy. Blue chips provide steady dividend income and downside protection during bear markets. Growth stocks drive appreciation during bull markets. Small-cap stocks add asymmetric upside potential. This diversification smooths returns over complete market cycles, reducing the impact of any single stock or sector underperforming. Learn more about different stock categories through comprehensive investing education resources that explain how each type fits different investor profiles and life stages. Understanding the small cap stock landscape helps you appreciate why blue chips serve as portfolio anchors rather than complete solutions.
Enhance your investment decisions with Tickerplace tools
Building a blue chip portfolio requires reliable data and efficient research tools. Tickerplace provides comprehensive resources designed specifically for investors evaluating large-cap stocks across global markets. The platform delivers real-time market data, detailed company financials, and technical analysis tools that streamline your research process.

The stock screener tool lets you filter thousands of companies by market cap, dividend yield, P/E ratios, and dozens of other criteria discussed throughout this guide. Set parameters matching blue chip characteristics, then compare candidates side by side. Access historical dividend data, earnings trends, and analyst ratings to inform your decisions. Investing education resources explain complex financial concepts in practical terms, helping you interpret the data correctly. Whether you’re researching US markets or exploring international opportunities, Tickerplace consolidates the information you need into one user-friendly platform, saving hours of manual research across multiple websites.
FAQ
Is a blue chip stock a safe investment?
Blue chip stocks are generally considered safer due to their financial stability, established market positions, and consistent dividend histories. However, they’re not risk-free investments. Market downturns affect all stocks, and industry disruption can erode even dominant companies over time. Diversification across multiple blue chips and other asset classes remains essential for managing risk effectively.
How do blue chip stocks pay dividends?
Blue chip companies typically distribute dividend payouts quarterly from their net earnings. These payments reflect management confidence in sustained profitability and commitment to returning capital to shareholders. Many blue chips increase dividends annually, creating growing income streams that outpace inflation. Dividend amounts depend on company performance, payout policies, and board decisions each quarter.
Can small investors buy blue chip stocks?
Yes, blue chip stocks are widely accessible through major exchanges like the NYSE and NASDAQ. Many brokers now offer fractional shares, allowing you to invest in expensive stocks like Amazon or Alphabet with as little as $10. This accessibility democratizes blue chip investing, letting small investors build diversified portfolios previously available only to wealthy individuals.
What sectors typically have blue chip stocks?
Common sectors include technology, finance, healthcare, consumer goods, and industrials. These sectors offer established companies with proven business models and strong competitive positions. Technology leaders like Microsoft and Apple dominate software and hardware markets. Financial giants like JPMorgan Chase control banking infrastructure. Healthcare companies like Johnson & Johnson benefit from demographic trends and essential product demand. Explore sector analysis to understand which industries align with your investment thesis and risk preferences.