Many investors believe small-cap stocks consistently outperform larger companies, but recent market data reveals a more complex reality. While small-caps historically deliver higher returns over extended periods, the past two decades show cyclical patterns where large-cap growth stocks have dominated. Understanding what defines a small-cap stock, how they perform across market cycles, and how to evaluate them strategically can unlock portfolio diversification opportunities that many investors overlook. This guide breaks down the essential metrics, benchmarks, and investment approaches you need to navigate small-cap investing in 2026.
Key takeaways
| Point | Details |
| Market cap definition | Small-cap stocks typically range from $300 million to $2 billion in market capitalization, though benchmark definitions vary. |
| Performance cycles matter | Small-caps show long-term outperformance historically but have underperformed large-caps in recent decades during growth-dominated regimes. |
| Liquidity considerations | Average daily trading volume matters as much as market cap when evaluating practical investability of small-cap positions. |
| Quality over size | Focus on earnings consistency, cash flow stability, and conservative leverage rather than chasing high-growth small-caps at premium valuations. |
| Cyclical opportunities | Small-caps tend to perform well post-recession and during rising interest rate periods, offering tactical allocation opportunities. |
Defining small-cap stocks: size, benchmarks, and market nuances
Small-cap stocks occupy a specific segment of the equity market defined primarily by market capitalization, but the exact boundaries vary depending on which benchmark or financial institution you consult. Most definitions place small-cap stocks between approximately $300 million and $2 billion in market value. This range captures companies that have moved beyond startup stage but haven’t yet reached the scale of mid-cap or large-cap corporations.

The Russell 2000 Index serves as the most widely recognized small-cap benchmark in U.S. markets. Interestingly, the Russell 2000 average market cap is $3.4 billion, which sits above the traditional $2 billion threshold. This discrepancy occurs because the index includes companies at the larger end of the small-cap spectrum and some that technically qualify as mid-caps. The Russell 2000 represents the bottom 2,000 stocks in the Russell 3000 Index, which covers roughly 98% of the investable U.S. equity market.
Below small-caps sit microcap stocks, an even smaller category with average market caps around $740 million. These companies often trade with lower valuations and significantly less liquidity than their small-cap counterparts. Understanding what is market cap and how it changes through corporate actions like a stock split helps investors navigate these size categories effectively.
Comparison of market cap categories and benchmarks:
| Category | Market Cap Range | Key Benchmark | Average Benchmark Cap |
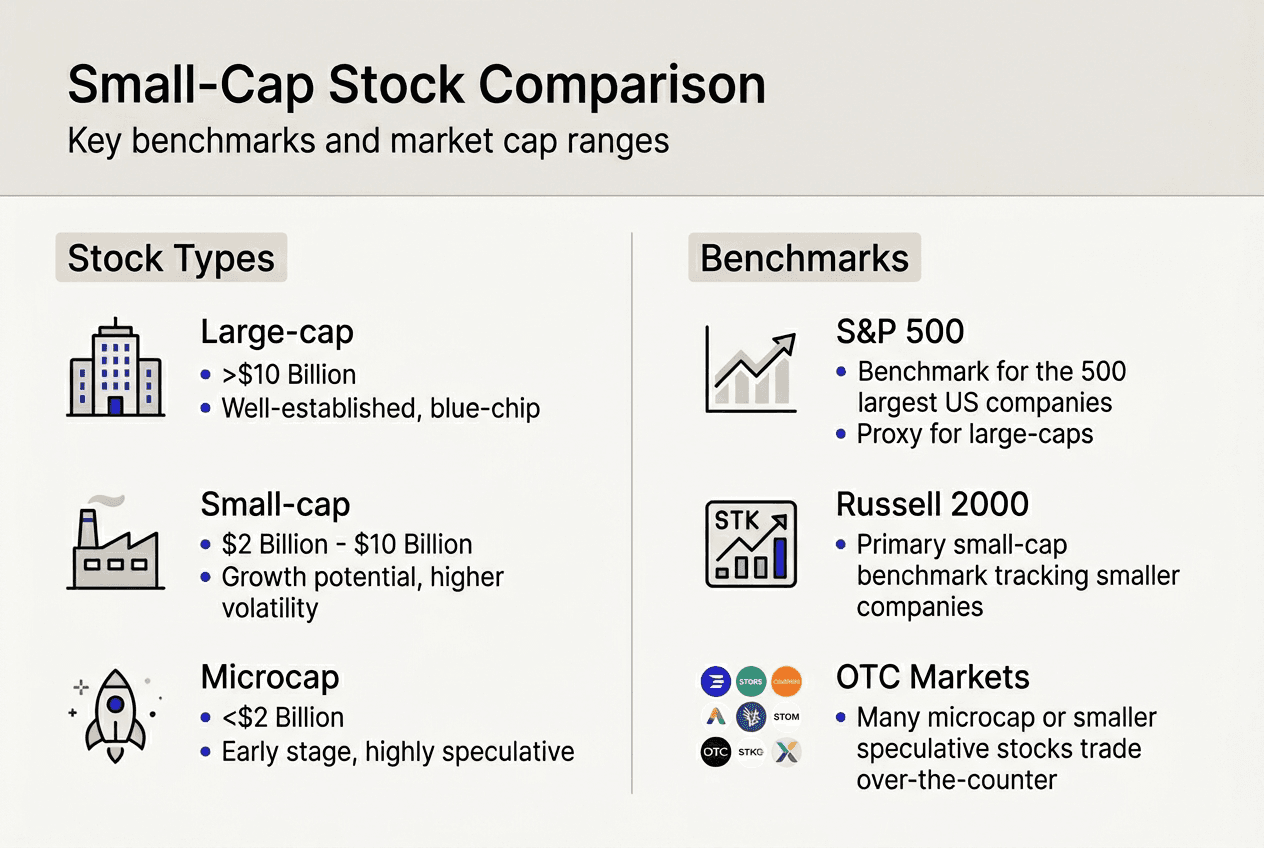
| Large-cap | $10B+ | Russell 1000 | $500B+ |
| Mid-cap | $2B to $10B | Russell Midcap | $6B to $8B |
| Small-cap | $300M to $2B | Russell 2000 | $3.4B |
| Microcap | Under $300M | Russell Microcap | $740M |
Pro Tip: Don’t rely solely on market capitalization when selecting small-cap investments. Average daily trading volume reveals whether you can actually enter and exit positions without moving the market price significantly. A $500 million company trading 50,000 shares daily presents different liquidity challenges than one trading 500,000 shares daily, even if both technically qualify as small-caps.
Historical performance of small-cap stocks versus large-cap stocks
The small-cap premium represents one of the most studied phenomena in financial markets. Academic research, particularly the Fama-French three-factor model, documented that small-caps historically outperform large-caps over extended periods. This premium compensated investors for taking on additional risk associated with smaller, less established companies. However, market cycles tell a more nuanced story than simple long-term averages suggest.
Since 2000, small-cap stocks have experienced prolonged periods of underperformance relative to large-caps. The dominance of large-cap growth stocks, particularly mega-cap technology companies, has reshaped return patterns over the past two decades. During these cycles, the concentration of returns in a handful of massive companies has made it challenging for small-cap indexes to keep pace. The world’s largest companies by market cap now represent unprecedented portions of total market value.
Yet performance cycles eventually turn. Small-caps often outperform during post-recession recoveries and periods of rising interest rates. When economic growth accelerates and rate environments shift, the relative valuation advantage of small-caps can drive substantial outperformance. Investors who optimize their stock trading workflow to identify these inflection points can capitalize on cyclical opportunities.
Historical return comparison by decade:
| Period | Russell 2000 Annualized Return | Russell 1000 Annualized Return | Small-Cap Premium |
| 1980s | 15.8% | 17.5% | -1.7% |
| 1990s | 12.4% | 18.2% | -5.8% |
| 2000s | 6.3% | -0.9% | +7.2% |
| 2010s | 11.8% | 13.6% | -1.8% |
| 2020-2025 | 8.9% | 14.2% | -5.3% |
Several factors drive these performance cycles:
-
Economic growth expectations influence small-cap valuations more dramatically than large-caps due to higher operational leverage
-
Interest rate environments affect borrowing costs disproportionately for smaller companies with less access to capital markets
-
Valuation regimes shift between growth and value orientations, with small-caps often carrying value characteristics
-
Market concentration in mega-cap stocks creates periods where passive index flows favor large-caps regardless of fundamentals
“Small-caps have lagged during the extended period of low rates and high valuations in large-cap growth stocks, but they’re positioned for potential outperformance as economic cycles turn and rate environments normalize. The key is recognizing that small-cap strength doesn’t automatically snapback after downturns but requires specific catalysts like improving credit conditions and broadening economic growth.”
Understanding these patterns helps investors time small-cap allocations more strategically. Tools like the Tickerplace stock research platform provide real-time data to monitor relative performance trends and identify when cyclical shifts may be emerging.
Evaluating and investing in small-cap stocks: metrics, risks, and strategies
Successful small-cap investing requires looking beyond market capitalization to assess true investment quality and risk. Liquidity represents the first critical consideration. A stock’s average daily volume determines whether you can build and exit positions efficiently. Quality small-caps with strong fundamentals often trade with sufficient volume to support institutional and individual investor participation, while illiquid names can trap capital during market stress.
Quality factors separate durable small-cap investments from speculative plays. Earnings consistency over multiple quarters demonstrates business model stability. Cash flow generation, not just accounting profits, reveals whether a company can fund operations and growth without constant capital raises. Conservative leverage ratios indicate management discipline and provide cushion during economic downturns. These quality metrics matter more in small-caps than large-caps because smaller companies have fewer resources to weather operational challenges.
Investors can explore detailed investing education metrics to understand how different financial ratios apply to small-cap analysis. The PEG ratio, which adjusts the price-to-earnings ratio for growth expectations, proves particularly useful for comparing small-cap valuations across different growth profiles.
Common small-cap investment risks:
-
Higher volatility during market downturns due to lower liquidity and institutional ownership
-
Limited analyst coverage creates information asymmetries between sophisticated and retail investors
-
Greater sensitivity to economic cycles and credit conditions affecting access to capital
-
Elevated business risk from less diversified revenue streams and competitive positions
-
Potential for permanent capital loss if companies fail or face severe operational challenges
Step-by-step approach to integrating small-caps into your portfolio:
-
Determine your appropriate small-cap allocation based on risk tolerance, typically 5% to 15% for diversified portfolios
-
Screen for quality characteristics including positive free cash flow, reasonable debt levels, and consistent revenue growth
-
Assess liquidity by reviewing average daily volume and ensuring it exceeds at least 100,000 shares for positions you plan to hold
-
Compare valuations using metrics like price-to-sales, price-to-book, and PEG ratios against sector peers and historical ranges
-
Monitor positions regularly since small-caps can experience rapid fundamental changes that require position adjustments
-
Rebalance periodically as small-cap positions grow or shrink relative to your target allocation
You can filter companies by market cap using resources like NYSE stocks by market cap and NASDAQ stocks by market cap to build your initial screening universe. These tools help identify which companies fall into true small-cap territory versus microcap or mid-cap categories.
Pro Tip: Current market conditions in 2026 favor quality small-caps that are undervalued relative to their growth and risk profiles. Avoid chasing expensive growth stories trading at premium multiples. Instead, focus on companies with proven business models, solid balance sheets, and valuations below their sector averages. These quality small-caps offer better risk-adjusted return potential than speculative high-growth names.
Explore Tickerplace tools to research and invest in small-cap stocks
Now that you understand how to evaluate small-cap stocks and integrate them into your portfolio strategy, you need practical tools to identify opportunities and monitor positions effectively. Tickerplace provides comprehensive research capabilities designed specifically for investors analyzing companies across market cap categories.

The Tickerplace platform delivers real-time market data, detailed financial metrics, and technical analysis for thousands of small-cap stocks. You can customize screening criteria to filter companies based on market cap ranges, liquidity thresholds, valuation metrics, and quality factors. The stock screener tool lets you build watchlists of small-caps meeting your specific investment criteria, whether you’re seeking value opportunities, growth potential, or dividend-paying smaller companies.
Beyond screening, Tickerplace offers investing education resources that explain key metrics and concepts in plain language. You can research individual companies, compare peers within industries, and track portfolio performance all within a single platform. This integrated approach streamlines the research process, helping you make informed decisions without jumping between multiple data sources.
Frequently asked questions about small-cap stocks
What market cap defines a small-cap stock in 2026?
Small-cap stocks typically have market capitalizations between $300 million and $2 billion, though exact definitions vary by index provider and financial institution. The Russell 2000, the primary small-cap benchmark, includes companies with an average market cap around $3.4 billion because it captures the upper range of the small-cap spectrum.
How do small-cap stocks differ from microcap stocks?
Microcap stocks represent even smaller companies than small-caps, typically with market capitalizations under $300 million and averaging around $740 million in benchmark indexes. Microcaps generally trade with significantly lower liquidity, receive less analyst coverage, and carry higher business risk than small-caps. The reduced liquidity makes microcaps more suitable for patient, long-term investors who can tolerate wider bid-ask spreads and position-building challenges.
What risks should investors be aware of in small-cap investing?
Small-cap stocks carry higher volatility than large-caps, especially during market downturns when liquidity dries up. They face greater sensitivity to economic cycles and credit conditions since they have less access to capital markets during stress periods. Limited analyst coverage creates information gaps, and less diversified business models increase the risk of permanent capital loss if competitive or operational challenges emerge. Proper position sizing and diversification across multiple small-cap holdings help manage these risks.
Can small-cap stocks outperform during economic downturns?
Small-caps typically underperform during economic downturns due to higher operational leverage and credit sensitivity. However, they often lead recoveries in the early stages of economic expansion when growth accelerates and credit conditions improve. The strongest small-cap performance usually occurs post-recession rather than during the downturn itself, making timing and patience crucial for capturing cyclical opportunities.
How can I find undervalued small-cap stocks?
Start by screening for companies trading below sector average valuations using metrics like price-to-sales, price-to-book, and PEG ratios. Focus on quality characteristics including positive free cash flow, reasonable debt levels, and consistent earnings growth to separate value opportunities from value traps. Check liquidity by ensuring average daily volume exceeds 100,000 shares for practical investability. Resources like the Tickerplace investing guide provide frameworks for systematic small-cap screening and evaluation.