A stock priced at $5 isn’t necessarily cheaper than one at $500. Many investors mistakenly equate low share prices with affordable investments, but this overlooks the fundamental metric that truly matters: market capitalization. Market cap reveals a company’s actual size and value by accounting for both share price and the total number of shares outstanding. This guide explains what market capitalization is, how it’s calculated, why it categorizes companies into different investment classes, and how you can use it alongside other metrics to make smarter investment decisions in 2026.
Table of Contents
-
Understanding Share Classes, Dilution, And Their Impact On Market Capitalization
-
How Market Capitalization Is Used To Categorize Companies And Guide Investment Decisions
-
Limitations Of Market Capitalization And How To Complement It With Other Metrics
-
Explore Market Capitalization And Stocks With Tickerplace Tools
Key takeaways
| Point | Details |
| Market cap formula | Market capitalization is calculated by multiplying share price by total shares outstanding |
| Company categories | Market cap classifies companies as large-cap, mid-cap, or small-cap, influencing risk and growth potential |
| Dynamic metric | Market cap fluctuates constantly as stock prices change throughout each trading day |
| Dilution factors | Stock options, convertible bonds, and different share classes can affect true market capitalization |
| Incomplete picture | Market cap shows only equity value and ignores debt, cash, and other financial obligations |
What is market capitalization and how is it calculated?
Market capitalization represents the total dollar value of a company’s outstanding shares of stock. It’s the most straightforward way to measure a company’s size in the equity markets. Market capitalization is calculated by multiplying the current stock price by the total number of shares outstanding. This simple formula gives you an instant snapshot of what the market believes the entire company is worth.
Here’s the basic formula:
Market Cap = Current Share Price × Total Shares Outstanding
Let’s work through a practical example. If Company A has 1 billion shares outstanding and each share trades at $50, the market capitalization is $50 billion. Company B might have shares trading at $200, but if it only has 100 million shares outstanding, its market cap is just $20 billion. Despite the higher share price, Company B is actually smaller than Company A by market value.
The calculation becomes more nuanced when companies have multiple share classes. Some firms issue Class A and Class B shares with different voting rights or dividend privileges. Tech companies often use dual-class structures to maintain founder control. When calculating total market cap, you need to account for all share classes, even though they may trade at different prices.
Here’s what you need for an accurate calculation:
-
Current market price per share
-
Total number of shares outstanding across all classes
-
Real-time data, since both inputs change constantly
-
Understanding of any restricted or treasury shares
Market cap fluctuates every second the market is open. A 5% increase in share price translates directly to a 5% increase in market capitalization, assuming the share count remains constant. This dynamic nature makes market cap a living metric that reflects investor sentiment and company performance in real time.
Pro Tip: Check the market cap formula and examples to see how different scenarios affect company valuations and why share count matters as much as price.
| Scenario | Share Price | Shares Outstanding | Market Cap |
| Company A | $50 | 1 billion | $50 billion |
| Company B | $200 | 100 million | $20 billion |
| Company C | $10 | 5 billion | $50 billion |
The table illustrates how market cap provides a level playing field for comparing companies regardless of their per-share price. Company A and Company C have identical market caps despite vastly different share prices, demonstrating why you can’t judge company size by stock price alone.
Understanding share classes, dilution, and their impact on Market capitalization
The basic market cap formula assumes all shares are equal, but reality is messier. Companies often have multiple share classes with different voting rights, dividend preferences, or conversion features. Class A shares might carry one vote per share while Class B shares carry ten votes, yet both contribute to the total market capitalization calculation. This structure affects how you interpret the per-share value and overall company control.
Share dilution adds another layer of complexity. When companies grant stock options to employees, issue convertible bonds, or promise restricted stock units, they create potential future shares that could increase the denominator in the market cap formula. Diluted market cap includes potential shares from in-the-money stock options, convertible bonds, warrants, and restricted stock units. This distinction matters significantly for growth companies and startups that rely heavily on equity compensation.
Consider a tech startup with 100 million shares outstanding trading at $20 per share, giving it a $2 billion basic market cap. However, the company has granted 20 million stock options to employees that are currently in the money. The diluted market cap would be calculated using 120 million shares, resulting in a $2.4 billion valuation. This 20% difference can dramatically affect valuation ratios and investment decisions.
Young companies face dilution challenges more acutely than established firms. Startups often compensate early employees with generous stock option packages, issue convertible notes to raise capital, and grant RSUs to attract talent. Each of these instruments represents future dilution that investors must factor into their valuation models. The gap between basic and diluted share count can reach 30% or more in high-growth technology companies.
Here’s how different instruments affect share count:
-
Stock options become shares when employees exercise them
-
Convertible bonds convert to equity at predetermined prices
-
Warrants give holders the right to purchase shares
-
RSUs vest and convert to common shares over time
-
Employee stock purchase plans create ongoing dilution
Pro Tip: Always compare both basic and diluted market cap when evaluating companies with significant share-based compensation and dilution, especially in the technology and biotech sectors where equity grants are standard practice.
| Dilution Source | Impact on Share Count | Typical in Which Companies |
| Stock options | 5 to 15% increase | Tech startups, growth companies |
| Convertible bonds | 3 to 10% increase | Companies raising flexible capital |
| Warrants | 2 to 5% increase | SPACs, certain financing deals |
| RSUs | 1 to 8% increase | Established tech firms |
The effects of share classes on per-share value become particularly visible during major corporate events. When a company splits its stock, the share count multiplies while the price divides proportionally, leaving market cap unchanged. Conversely, reverse splits reduce share count while increasing price per share, again maintaining the same total market capitalization.
How Market capitalization is used to categorize companies and guide investment decisions
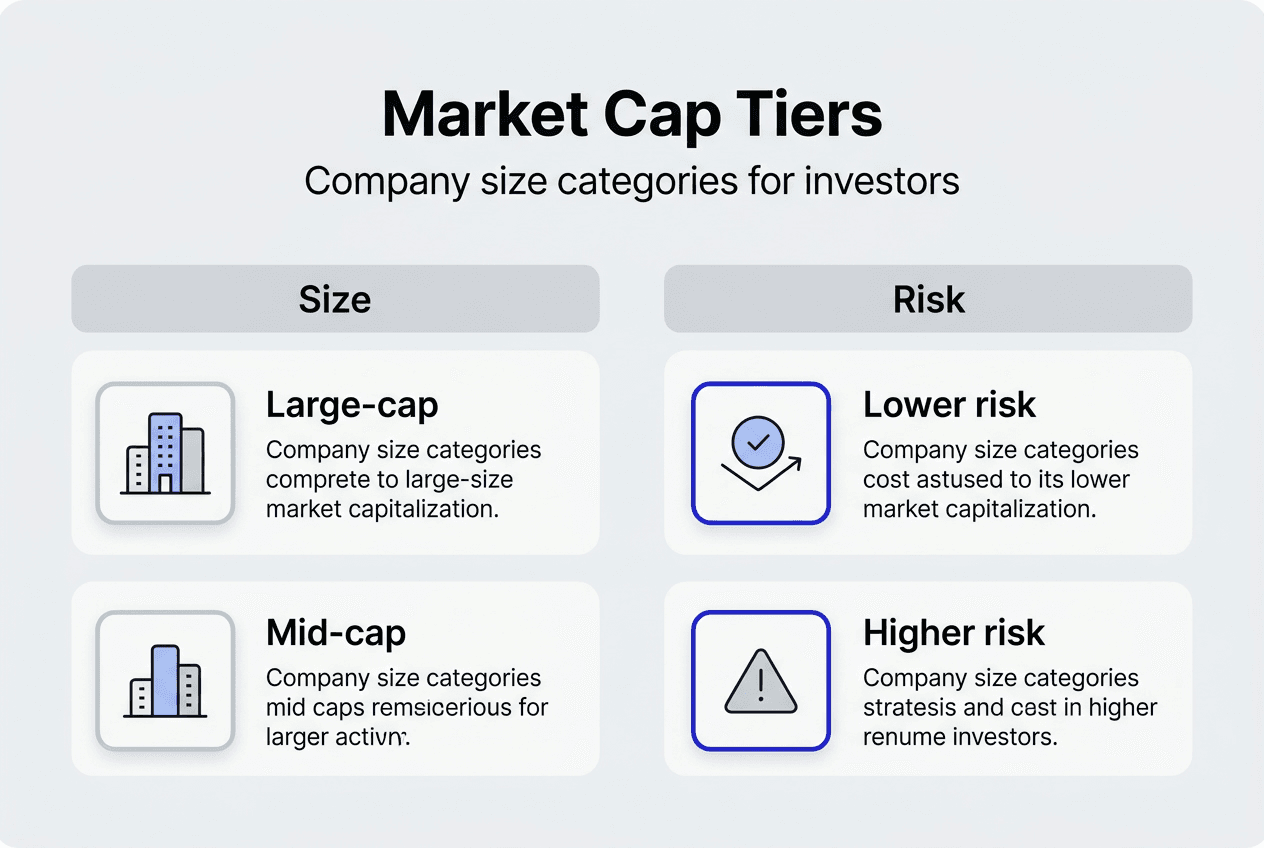
Investors and analysts use market cap to classify companies into distinct size categories, each carrying different risk and return characteristics. Large-cap companies are defined as those with market capitalization over $10 billion. These established corporations typically offer stability, regular dividends, and lower volatility. Mid-cap companies range from $2 billion to $10 billion, balancing growth potential with moderate risk. Small-cap companies fall below $2 billion and often deliver higher growth rates alongside increased volatility.
These categories directly influence investment strategies and portfolio construction. Conservative investors gravitate toward large-cap stocks for steady returns and capital preservation. Growth-focused investors often favor mid-cap companies that have proven business models but still offer expansion potential. Aggressive investors willing to accept higher risk pursue small-cap stocks for their explosive growth possibilities. Market capitalization is used to categorize companies by size, influencing investment strategies and risk profiles across different investor types.
Index construction relies heavily on market cap for weighting decisions. The S&P 500 uses market cap weighting, meaning larger companies like Apple and Microsoft have greater influence on index performance than smaller constituents. This methodology ensures that the index reflects the actual market’s composition and movements. When a company’s market cap grows or shrinks, its index weight adjusts automatically, triggering rebalancing by index funds.
ETFs and mutual funds structure their portfolios around market cap categories:
-
Large-cap funds focus on stability and blue-chip companies
-
Mid-cap funds target companies in expansion phases
-
Small-cap funds seek high-growth opportunities
-
Market-cap-weighted funds allocate based on company size
-
Equal-weighted funds ignore market cap for balanced exposure
Market cap enables meaningful peer comparisons within industries. Comparing a $500 billion tech giant to a $5 billion software company yields little insight, but comparing companies of similar market cap reveals competitive positioning and relative valuation. Analysts use market cap to identify comparable companies for valuation multiples, ensuring apples-to-apples comparisons that inform investment decisions.
“Market capitalization provides the foundation for understanding company size, but investors must combine it with other metrics like revenue growth, profitability, and debt levels for comprehensive analysis.”
You can explore the largest companies by market capitalization to see how global leaders stack up and understand which sectors dominate the upper tiers. The US stocks by market cap listing shows domestic market composition and helps identify investment opportunities across different size categories.
| Market Cap Category | Size Range | Typical Characteristics | Risk Level |
| Large-cap | Over $10 billion | Established, stable, dividend-paying | Lower |
| Mid-cap | $2 billion to $10 billion | Growing, balanced risk-return | Moderate |
| Small-cap | Under $2 billion | High growth, volatile, emerging | Higher |
Limitations of market capitalization and how to complement it with other metrics
Market cap tells only part of the valuation story. Market cap shows only equity value, ignoring debt, cash, and other obligations, providing an incomplete company worth view. Two companies with identical $50 billion market caps might have vastly different financial health if one carries $30 billion in debt while the other holds $20 billion in cash. Relying solely on market cap for valuation decisions can lead to costly mistakes.
Enterprise value addresses these limitations by incorporating debt and cash into the calculation. The formula adds total debt to market cap, then subtracts cash and cash equivalents. This metric represents what an acquirer would actually pay to buy the entire company, including assuming its debts and pocketing its cash. Enterprise value provides a more accurate picture for comparing companies with different capital structures.
Consider two retailers with $10 billion market caps. Retailer A has $5 billion in debt and $1 billion in cash, giving it a $14 billion enterprise value. Retailer B operates debt-free with $3 billion in cash, resulting in a $7 billion enterprise value. Despite identical market caps, Retailer B is actually the cheaper acquisition target and likely the healthier business. Understanding the difference between market cap and enterprise value is fundamental to accurate financial analysis.
When should you prefer enterprise value over market cap?
-
Comparing companies across industries with different capital structures
-
Evaluating acquisition targets or merger scenarios
-
Calculating valuation multiples like EV/EBITDA or EV/Sales
-
Analyzing highly leveraged or cash-rich companies
-
Assessing capital-intensive industries like utilities or telecommunications
Market cap can mislead in specific scenarios. A company with falling share prices might appear to be a bargain based on market cap alone, but if it’s accumulating debt to fund operations, the enterprise value tells a different story. Conversely, a company with rising market cap but deteriorating fundamentals might be overvalued when you factor in its debt burden.
Pro Tip: Always check enterprise value differences when evaluating companies in capital-intensive industries or those with significant debt positions to avoid valuation traps.
Complementary metrics provide additional context:
-
Price-to-earnings ratio measures profitability relative to market cap
-
Price-to-book ratio compares market cap to net asset value
-
Revenue and earnings growth rates indicate business momentum
-
Free cash flow shows actual cash generation ability
-
Debt-to-equity ratio reveals financial leverage and risk
| Metric | What It Measures | Best Used For |
| Market Cap | Equity value only | Quick size comparison, index weighting |
| Enterprise Value | Total company value including debt | Acquisition analysis, capital structure comparison |
| EV/EBITDA | Operating performance vs. total value | Cross-company valuation |
| Price-to-Earnings | Profitability relative to equity value | Earnings-based valuation |
Combining market cap with these additional metrics creates a comprehensive valuation framework. No single number tells the complete story, but together they reveal whether a company is fairly valued, overpriced, or potentially undervalued relative to its peers and fundamentals.
Explore market capitalization and stocks with tickerplace tools
Now that you understand market capitalization’s role in investment analysis, put that knowledge to work with practical tools designed for informed decision-making. Tickerplace research and analysis tool provides real-time stock prices, market capitalization data, and comprehensive company profiles across global markets. You can track how market cap changes throughout the trading day and compare companies within the same size category.

The tickerplace stock screener lets you filter thousands of companies by market cap ranges, helping you identify large-cap stability, mid-cap growth potential, or small-cap opportunities that match your investment strategy. Combine market cap filters with fundamental metrics like P/E ratios, debt levels, and revenue growth to discover stocks that meet your specific criteria. Deepen your investing knowledge with tickerplace investing education resources that explain key concepts and strategies for building a stronger portfolio.
Frequently asked questions
What is market capitalization?
Market capitalization is the total market value of a company’s outstanding shares of stock. You calculate it by multiplying the current share price by the total number of shares outstanding. It represents what the market believes the entire company is worth at any given moment.
How do different share classes affect market capitalization?
Different share classes have varied voting rights or dividend privileges but all contribute to total market cap. You must include all share classes in your calculation, even though they may trade at different prices. The combined value of all classes gives you the complete market capitalization.
Why does market capitalization fluctuate throughout the trading day?
Market cap equals share price multiplied by shares outstanding. Stock prices vary constantly during trading hours as investors buy and sell shares. Each price change directly affects market capitalization, causing it to rise and fall in real time throughout the trading session.
Is market capitalization enough to determine a company’s value?
Market cap shows only equity value and excludes debt and cash reserves. Enterprise value provides a fuller company valuation by adding debt and subtracting cash from market cap. Use both metrics together for accurate valuation analysis and investment decisions.