TL;DR:
RSI is a nuanced momentum indicator that signals trend strength and potential reversals.
Proper interpretation requires understanding context, divergence, and confirming with price action.
Combining RSI with other tools and customizing settings enhances trading accuracy and reduces mistakes.
Many traders treat the Relative Strength Index as a simple buy/sell signal generator, which is precisely where costly mistakes begin. RSI is a nuanced momentum tool that, when misread, can push you into trades at exactly the wrong moment. Studies show that traders who misinterpret overbought and oversold signals without context frequently exit winning positions too early or enter losing ones too late. This article walks you through what RSI really measures, how it signals trends and reversals, how to apply it in actual trading strategies, and how to avoid the pitfalls that trip up even experienced market participants.
Key Takeaways
| Point | Details |
|---|---|
| RSI is a momentum tool | The Relative Strength Index measures the velocity of price changes to highlight overbought and oversold stocks. |
| Trend signals and reversals | RSI helps traders anticipate when a market or stock may shift direction, especially at extreme values. |
| Application drives results | Integrating RSI with other indicators and careful interpretation makes it far more effective for real trading. |
| Avoid common pitfalls | Don’t rely solely on RSI signals—combine with volume, fundamentals, and backtesting for best outcomes. |
What is the Relative Strength Index (RSI)?
The Relative Strength Index is a momentum oscillator developed by J. Welles Wilder Jr. and introduced in his 1978 book New Concepts in Technical Trading Systems. It measures price movement speed and change, giving traders a standardized way to evaluate whether a stock is gaining or losing momentum relative to its recent price history.
RSI operates on a scale from 0 to 100. The standard calculation uses 14 trading periods, though this can be adjusted. Here is how the core formula works:
-
Step 1: Calculate the average gain over the last 14 periods.
-
Step 2: Calculate the average loss over the same 14 periods.
-
Step 3: Divide average gain by average loss to get the Relative Strength (RS).
-
Step 4: Apply the formula: RSI = 100 minus (100 divided by (1 plus RS)).
The result is a single number between 0 and 100 that updates with every new price bar. The table below summarizes the standard RSI interpretation zones:
| RSI Range | Market Condition | Typical Interpretation |
|---|---|---|
| Above 70 | Overbought | Potential reversal or pullback |
| 50 to 70 | Bullish momentum | Uptrend continuation likely |
| 30 to 50 | Bearish momentum | Downtrend continuation likely |
| Below 30 | Oversold | Potential reversal or bounce |
Understanding these zones is the foundation for reading RSI correctly. Knowing how stock indices guide broader market momentum can also sharpen your RSI interpretation, since sector and index trends often influence individual stock readings.
How RSI signals market trends and reversals
With a foundational understanding of what RSI is, let’s see how it actually flags market trends and reversals in real-world scenarios.
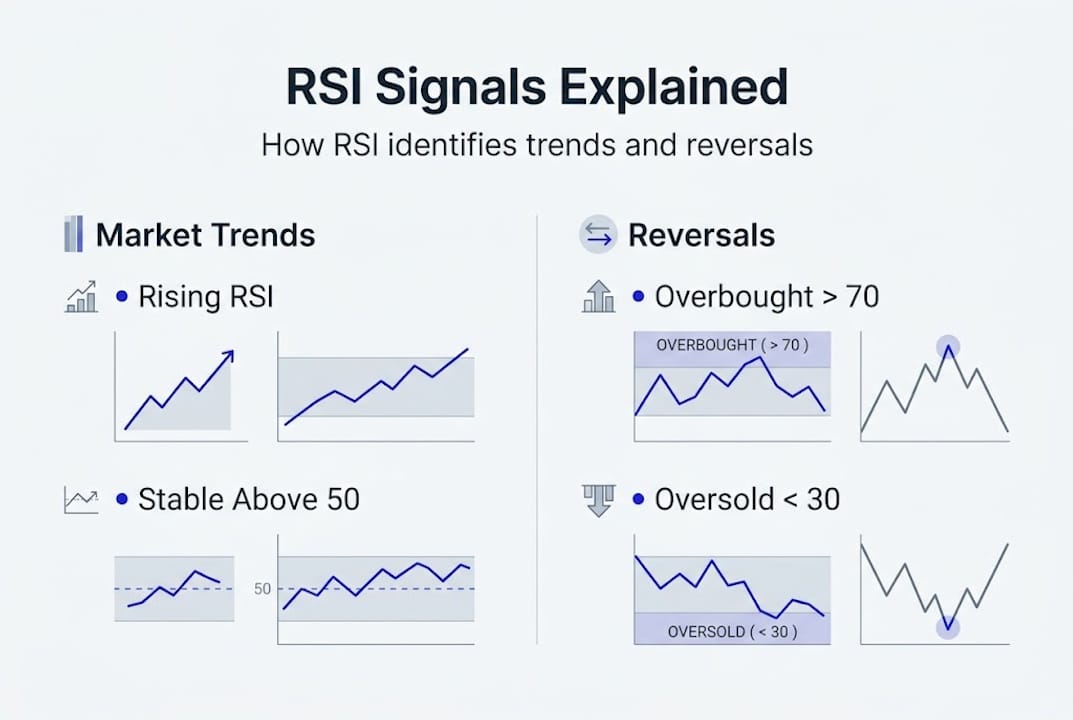
RSI does two primary jobs: it confirms existing trends and warns of potential reversals. Overbought and oversold conditions help anticipate trend changes, but the signal’s reliability depends heavily on context. A stock can stay above 70 for weeks during a strong uptrend, and blindly shorting it at that level has burned many traders.
Here is a practical comparison of overbought versus oversold RSI conditions:
| Condition | RSI Level | Price Behavior | Risk Factor |
|---|---|---|---|
| Overbought | Above 70 | Rising, often extended | Reversal or pause likely |
| Oversold | Below 30 | Falling, often compressed | Bounce or reversal likely |
| Neutral | 40 to 60 | Ranging or consolidating | Low directional signal |
To interpret RSI signals systematically, follow these steps:
-
Identify the primary trend using a longer timeframe chart before reading RSI on a shorter one.
-
Check RSI relative to the 50 level. Above 50 generally favors buyers; below 50 favors sellers.
-
Look for divergence. If price makes a new high but RSI makes a lower high, that bearish divergence signals weakening momentum.
-
Confirm with price action. A candlestick reversal pattern near an RSI extreme adds weight to the signal.
-
Set your entry only after confirmation, not the moment RSI crosses a threshold.
Pro Tip: RSI divergence is one of the most reliable signals, but it requires patience. A bearish divergence can persist for several bars before price actually turns. Wait for price confirmation before acting, and use reading market data techniques to validate your read.
Applying RSI to stock trading strategies
Now that you know how RSI highlights trends and reversals, let’s explore how you can apply it to real-world trading strategies for better risk-adjusted returns.
RSI is commonly integrated into trading strategies for entry and exit points, and it pairs well with several well-known frameworks. Here are the core application methods:
-
RSI crossover strategy: Enter a long trade when RSI crosses above 30 (recovering from oversold), and consider exiting or shorting when it crosses below 70 (falling from overbought).
-
RSI divergence strategy: Trade in the direction of divergence confirmation. Bullish divergence (price falls, RSI rises) signals a potential long entry; bearish divergence signals a potential short.
-
RSI with moving averages: Combine RSI with a 50-day or 200-day moving average to filter trades. Only take RSI buy signals when price is above the moving average.
-
RSI with volume: A rising RSI supported by increasing volume is a stronger signal than one occurring on thin volume.
“No single indicator wins consistently on its own. RSI is most powerful as one voice in a chorus of confirming signals.”
For stop-loss placement, many traders set stops just beyond the recent swing high or low that corresponded with the RSI extreme. This approach ties your risk level to actual price structure rather than arbitrary percentages. Using stock filters to screen for stocks already showing RSI setups can save significant time in your analysis process. You can also pair RSI signals with a ROE calculator to ensure the underlying fundamentals justify the trade.

Pro Tip: Never rely solely on RSI. Traders who combine RSI with at least one trend indicator and one volume metric consistently produce more reliable signals than those using RSI in isolation.
Common pitfalls and advanced techniques for RSI
Even seasoned traders can fall into traps with RSI. Here’s how to avoid common pitfalls and add extra power to your RSI toolkit.
The most frequent mistakes traders make with RSI include:
-
Treating overbought as an automatic sell signal. In strong uptrends, RSI can stay above 70 for extended periods. Selling too early costs you significant gains.
-
Ignoring the broader market context. An oversold RSI during a broad market selloff is far less reliable than the same signal in a stable or rising market.
-
Using the default 14-period setting for every asset. Volatile assets like small-cap stocks or crypto-adjacent equities often respond better to shorter periods (7 to 9), while slower-moving assets may suit longer periods (21 to 25).
-
Skipping backtesting. Applying an RSI strategy without testing it on historical data is speculative at best.
RSI’s effectiveness improves when used alongside other metrics and customized for different assets, which means your default settings should be a starting point, not a final answer.
For advanced application, consider these techniques:
-
Multi-timeframe RSI analysis: Check RSI on a weekly chart for trend direction, then use a daily chart RSI for precise entry timing.
-
RSI with Bollinger Bands: When RSI is oversold and price touches the lower Bollinger Band simultaneously, the confluence creates a higher-probability setup.
-
Sector-level RSI comparison: Comparing RSI readings across stocks in the same sector helps identify relative strength within a group, a powerful edge for sector rotation strategies.
Pro Tip: Before trading any RSI strategy live, run it through at least 50 historical trades using a market data guide to assess win rate and risk/reward ratio. This discipline separates systematic traders from reactive ones.
Why mastering RSI is more than just memorizing numbers
Here is an uncomfortable truth: most traders who study RSI focus entirely on the levels, 30, 50, 70, and miss the richer story RSI tells about market psychology. The number itself is not the insight. The context around the number is.
A stock hitting RSI 72 during a sector-wide rally driven by strong earnings is a very different situation from a stock hitting RSI 72 on low volume with deteriorating fundamentals. Conventional RSI rules treat both identically. Experienced traders do not.
True RSI mastery means reading momentum as a reflection of collective trader behavior, not just a mechanical threshold. Pair your RSI reads with market reading tips and price action context, and you will start seeing setups that rule-based traders consistently miss. That contextual edge is where real performance lives.
Take your trading analysis to the next level
If you’re ready to make RSI part of your trading toolkit, here’s how Tickerplace’s technology can support smarter stock analysis.
Tickerplace brings together real-time market data, technical analysis tools, and research resources in one platform built for serious investors and traders.

Use the stock screener to filter equities by RSI levels, volume trends, and fundamental metrics simultaneously, saving hours of manual research. The stock return calculator helps you model potential outcomes before you commit capital. Whether you are refining an RSI divergence strategy or screening for oversold opportunities in a specific sector, Tickerplace gives you the data infrastructure to act with confidence.
Frequently asked questions
What does RSI indicate in stock trading?
RSI shows whether a stock is potentially overbought or oversold, helping identify trend changes. RSI values above 70 suggest overbought conditions, while readings below 30 indicate oversold territory.
How do you calculate RSI?
RSI uses average gains and losses over a set period, typically 14 trading sessions, to produce a value between 0 and 100. The RSI calculation involves dividing average gain by average loss, then applying a standardized formula.
Can RSI be used for all types of stocks?
RSI works across most asset types, but it performs best when combined with other indicators and adjusted for each asset’s volatility profile. RSI’s effectiveness improves when customized rather than applied with default settings universally.
What are common mistakes when using RSI?
Traders often treat RSI overbought or oversold levels as automatic signals without confirming with price action or volume. False RSI signals are common, and best practices involve combining multiple metrics before executing a trade.