There are more than 58,000 publicly traded stocks worldwide, yet most disciplined investors actively follow fewer than 50 at any given time. That gap is not a coincidence. Without a structured way to narrow the field, even experienced analysts risk spending hours on companies that never fit their strategy. Stock screeners solve this by letting you apply specific, repeatable criteria to thousands of securities at once, returning only the names worth a closer look. This article explains what stock filters are, how they work, the types of criteria available, what the performance data says, and how to build a filtering discipline that actually improves your results over time.
Key Takeaways
| Point | Details |
|---|---|
| Streamline stock selection | Stock filters narrow the universe of stocks quickly, helping you focus only on strong candidates. |
| Quantitative meets qualitative | Best results come from mixing numerical screens with real-world company insights. |
| Adapt and review regularly | Revisit and update your filters to reflect changing markets and new investment targets. |
| No one-size-fits-all screen | Performance varies over time, so tailor your screening approach to your goals and strategy. |
What are stock filters and how do they work?
A stock filter, often called a screener, is a tool that scans a universe of equities and returns only those that meet a defined set of conditions. Think of it as a query engine for the market: you specify the rules, and the tool does the sorting. The result is a focused shortlist instead of an overwhelming catalog of thousands of names.
Understanding how stock screeners work starts with recognizing that they operate on structured data. Every listed company reports financials, and screeners index that data so you can filter by price, valuation, profitability, growth, or dozens of other variables. The comparison can be absolute (P/E below 15), relative to peers (ROE in the top quartile of its sector), or historical (revenue growth above its own five-year average).
The practical workflow follows a logical sequence, as outlined in research on multi-stage screening processes:
-
Define your objective: Are you hunting for undervalued dividend payers, high-growth small caps, or quality compounders?
-
Apply primary quantitative criteria: Start with the two or three metrics most central to your thesis, such as P/E below 15 and return on equity above 15%.
-
Add secondary quality filters: Layer in debt-to-equity, current ratio, or operating margin to screen out financially fragile companies.
-
Conduct qualitative review: Once the list is short, read the business, assess management, and evaluate competitive positioning.
“The most effective screens use a staged approach: broad quantitative entry criteria first, then progressively tighter quality gates, with qualitative review reserved for the final shortlist.”
This staged approach delivers two underappreciated benefits. First, it saves significant time by eliminating irrelevant companies before you ever open an annual report. Second, it enforces objectivity. Investors are prone to confirmation bias, and a filter does not care how exciting a story sounds. You can explore the stock metrics guide on Tickerplace to see which data points are most relevant to your strategy, and the investing blog offers further context on building a repeatable research process.
Types of stock filters: Quantitative and qualitative criteria
Not all filters are created equal, and choosing the right mix depends on your investment goals. Broadly, criteria fall into two categories: quantitative, which are numeric and objective, and qualitative, which require judgment and context.
Quantitative filters are the backbone of most screens. Common criteria include price-to-earnings ratio, return on equity, debt-to-equity ratio, operating margin, revenue growth rate, and free cash flow yield. These metrics can be compared against absolute thresholds, sector medians, or a company’s own historical range.
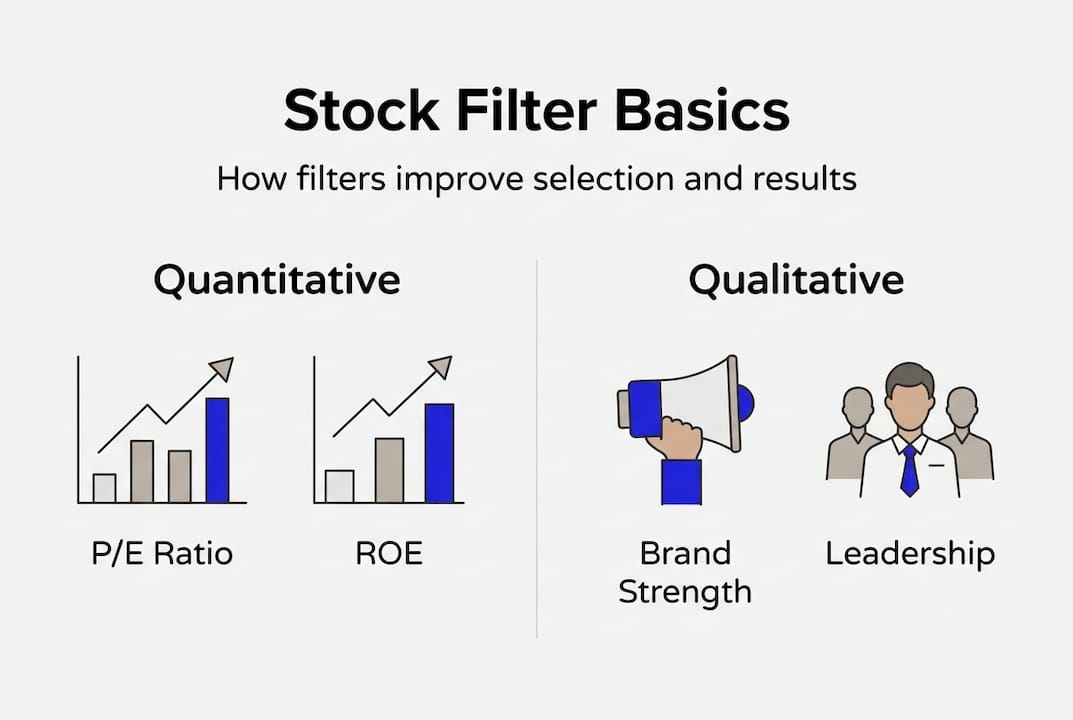
Qualitative filters are harder to automate but equally important. They include factors like management track record, brand strength, regulatory environment, and the presence of a durable competitive advantage (often called an economic moat). Most screeners cannot quantify these directly, so they are best applied during the manual review stage.
Here is a comparison of the most widely used filter types:
| Filter type | Example metric | Best used for |
|---|---|---|
| Valuation | P/E, P/B, EV/EBITDA | Value investing |
| Profitability | ROE, operating margin | Quality screening |
| Growth | Revenue growth, EPS growth | Growth investing |
| Financial health | Debt/equity, current ratio | Risk management |
| Income | Dividend yield, payout ratio | Dividend investing |
| Momentum | Relative price strength, RSI | Technical screening |
For a deeper look at how these metrics interact, the analyze stocks guide on Tickerplace walks through practical evaluation frameworks. You can also review choosing the right screen for strategy-specific guidance.
Mixing filter types is where real differentiation happens. A value investor might combine a low P/E with a high ROE and low debt. A dividend investor might pair a high yield with a conservative payout ratio and consistent earnings growth. A growth investor might focus on revenue acceleration and expanding margins.
Pro Tip: Start with three to five filters maximum. Adding too many criteria shrinks your results list to near zero and introduces data noise. You can always tighten the screen after reviewing the initial output. The goal is a manageable shortlist, not a single “perfect” stock.
Expert insights: How top investors use and refine stock filters
Experienced investors treat screeners as the beginning of the research process, not the end. The distinction matters because a screener can surface a candidate, but it cannot tell you whether the business is genuinely excellent or merely numerically convenient.
Several best practices from advanced users stand out:
-
Use fewer, better filters. A screen with 12 criteria often produces a list of zero or one stock, which defeats the purpose. Three to six well-chosen filters consistently outperform bloated screens.
-
Combine fundamental and technical criteria. Pairing a valuation filter (low P/B) with a momentum signal (price above 200-day moving average) helps you find value that the market is beginning to recognize, rather than value that keeps falling.
-
Save your templates. Consistency is an edge. Saving your screen settings lets you rerun the same filter monthly, compare results over time, and detect when market conditions are shifting your output.
-
Schedule regular reviews. Running a screen once is a snapshot. Running it every four to six weeks creates a pattern, and patterns reveal opportunities and risks that single-point analysis misses.
“The investors who get the most from screening tools are those who treat each output as a research prompt, not a buy signal.”
Common mistakes are just as instructive. Overfiltering is the most frequent error, producing empty or near-empty results that waste time. Ignoring data limitations is another: screeners rely on reported financials, which can lag reality or reflect one-time items. Skipping qualitative due diligence after screening is perhaps the costliest mistake, since a company can pass every quantitative test and still be a poor investment due to weak management or a deteriorating competitive position.
Pro Tip: Back-test your screen against historical data before committing capital. Most professional platforms allow you to see how a given set of criteria would have performed over prior periods. Revisit and adjust your screen at least once per quarter as market conditions evolve. You can optimize your workflow by building a structured review cadence around your screening templates.
Also explore screen strategy examples to see how named strategies are constructed and maintained by experienced practitioners.
Real results: Evidence and proven stock filter strategies
Strategy is useful, but performance data is decisive. The American Association of Individual Investors (AAII) has tracked 55 stock screens since approximately 1998, providing one of the longest-running independent records of screener performance available.
The 2025 AAII screen review produced several notable findings:
-
78% of tracked screens gained in 2025, with an average return of 14.7%.
-
25 of 55 screens beat the S&P 500, which returned 16.1% over the same period.
-
The O’Shaughnessy Tiny Titans screen, which combines high value, small market capitalization, and strong price momentum, ranked among the top performers.
-
The Wanger Revised screen delivered a 65.9% year-to-date return, making it the standout strategy of the year.
| Screen name | Key criteria | 2025 performance |
|---|---|---|
| Wanger Revised | Small cap, growth, quality | 65.9% YTD |
| O’Shaughnessy Tiny Titans | Value, small cap, momentum | Top quartile |
| S&P 500 benchmark | Broad market | 16.1% |
These results reinforce a critical point: no single screen dominates across every market cycle. Growth and momentum strategies shine in trending markets; value screens tend to recover during corrections. Research on formula investing strategies further confirms that systematic, rules-based approaches produce positive returns out of sample, but require ongoing adaptation.
Here is how to use performance data to refine your own filters:
-
Identify which factor clusters are working in the current environment (value, growth, momentum, quality).
-
Compare your screen’s output against the broader market over the past 12 months.
-
Adjust one variable at a time to isolate what is driving or dragging performance.
-
Document every change so you can track the impact of each adjustment over subsequent periods.
-
Use the stock screener tool on Tickerplace to apply these steps with real-time data and flexible filter combinations.
The takeaway is clear: systematic filtering generates real, measurable results, but only when paired with consistent execution and periodic recalibration.
Our take: Stock filters as a discipline, not a shortcut
Here is something most articles on screening tools will not tell you: the filter itself is rarely the edge. The edge is in how you use it, how often you revisit it, and how honestly you evaluate its output.
Many investors adopt a screen, run it once, buy the results, and then wonder why performance diverges from expectations. The problem is not the screen. It is the absence of discipline around it. No screen is perfect, and performance varies significantly by market regime. Growth and momentum criteria that worked brilliantly in a bull market can become liabilities during a rotation into value.
The investors who consistently benefit from screening are those who treat it as an iterative process. They adapt their criteria as conditions change, they supplement quantitative outputs with genuine business analysis, and they resist the temptation to over-optimize. A screen that produces 20 solid candidates is more useful than one engineered to produce a single “perfect” name.
We believe the real value of stock filters lies in the discipline they impose, not the answers they provide. They force you to define what you are looking for before you start looking, which is a habit that improves every other part of your investment process. Pair that discipline with the smarter investment decisions framework, and you have a research process that compounds in quality over time.
Take your screening to the next level with Tickerplace
Ready to apply what you have learned? Tickerplace gives you access to an advanced stock screener built for both individual investors and professional analysts, with flexible filter combinations across valuation, profitability, growth, and technical criteria. You can move from a broad market universe to a focused shortlist in minutes.

Beyond screening, the research and analysis platform offers detailed financial metrics, company profiles, and market data to support every stage of your due diligence. Use the stock return calculator to model potential outcomes before you commit capital. Whether you are refining an existing strategy or building one from scratch, Tickerplace provides the tools to make your process more consistent, more efficient, and more informed.
Frequently asked questions
What is the main advantage of using stock filters?
Stock filters let you narrow thousands of equities to a focused shortlist that matches your specific investment criteria, saving time and enforcing analytical discipline across every search.
Are there risks to relying only on stock screeners?
Yes. Screeners carry real limitations, including historical data bias, no qualitative context, and the risk of false positives, so always supplement your screen output with thorough company-level research.
How often should I update or rerun my stock filters?
Best practices recommend rerunning your saved screen templates every four to six weeks, and revisiting the criteria themselves whenever your investment goals or broader market conditions shift meaningfully.
Which stock filter criteria are most effective?
Blending value, growth, momentum, and quality factors typically produces the strongest results; top AAII screens consistently emphasize financial strength, competitive advantages, and upward earnings revisions as core components.