
TL;DR:
- The current ripple price is approximately $1.10 USD, reflecting a market that is range-bound near recent highs. XRP's price is driven by market supply, demand, and sentiment, with high trading volume confirming trend strength. Ripple USD (RLUSD) differs as a stablecoin pegged to the dollar, while XRP is a volatile market asset.
The ripple usd price is the current market value of one XRP token against the US dollar, and as of June 2026, that value sits at approximately $1.10 USD. XRP is the native digital asset of the Ripple network, designed for cross-border payments and institutional liquidity. Traders tracking the current ripple value must also understand that "Ripple USD" refers to two distinct things: the volatile XRP token and the separate RLUSD stablecoin pegged 1:1 to the dollar. Confusing the two leads to real investment errors, and this guide draws a clear line between them.
What factors influence the ripple USD price on crypto markets?
The XRP price in USD is driven by the same core forces that move any liquid asset: supply, demand, and market sentiment. XRP has a circulating supply of roughly 62 billion tokens and a market cap near $68 billion. That scale means large institutional orders can shift the price meaningfully within a single session.
Key factors that move the XRP price on any given day include:
- Trading volume and liquidity: Higher daily volume signals stronger market participation. Low-volume price moves are far less reliable as trend indicators.
- Market sentiment and news: Regulatory decisions involving Ripple Labs, partnership announcements, and broader crypto market conditions all feed directly into price action.
- Technical indicators: Price charts, moving averages, and volume bars help traders separate short-term noise from genuine directional moves.
- Time horizon selection: A 5-minute chart and a weekly chart tell completely different stories. Choosing the wrong time frame is one of the most common analytical mistakes traders make.
Short-term XRP price swings are frequent and can be sharp. Traders who rely on a single data point, such as a one-hour candle, without cross-referencing volume or a longer time frame, are making decisions with incomplete information.
Pro Tip: When checking the usd to ripple exchange rate, always look at at least two time frames simultaneously. A price move that looks significant on a 15-minute chart may be invisible on a daily chart, which tells you it is likely noise rather than a trend.

How does ripple USD (RLUSD) differ from XRP?
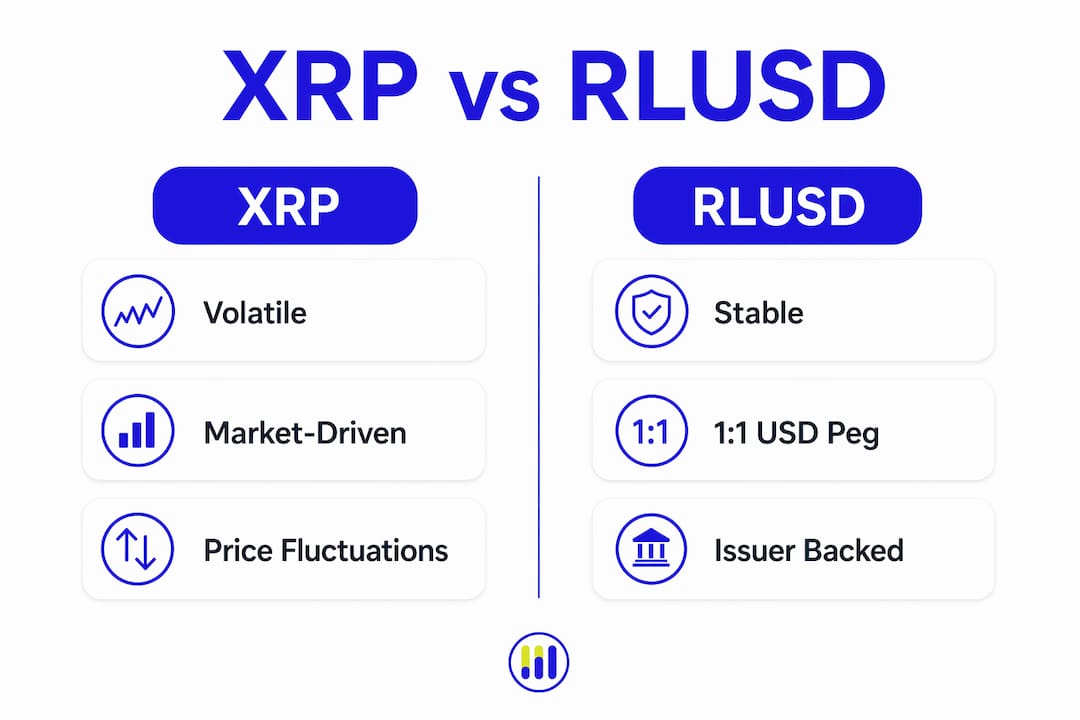
Ripple USD, or RLUSD, is a stablecoin pegged 1:1 to the US dollar, issued by Ripple Labs to provide price stability for institutional and retail users. XRP, by contrast, is a market-driven asset whose price fluctuates continuously based on trading activity and sentiment.
The distinction matters enormously for portfolio management. Here is a direct comparison:
| Feature | XRP | RLUSD |
|---|---|---|
| Price behavior | Volatile, market-driven | Stable, pegged to $1.00 USD |
| All-time high | Multiple dollars above current price | Near $1.07 |
| All-time low | Fractions of a cent | Near $0.9623 |
| Market cap | ~$68 billion | ~$1.65 billion |
| Primary use case | Speculation, cross-border payments | Stable value transfer, DeFi liquidity |
Users frequently confuse XRP with RLUSD, which creates misaligned expectations. A trader expecting RLUSD to appreciate like XRP will be disappointed. An investor expecting XRP to hold a stable $1.00 value will be caught off guard by volatility spikes. Knowing which asset you hold is the starting point for any rational position.
Beyond price stability, RLUSD holders should also monitor regulatory updates and issuer transparency disclosures from Ripple Labs. Stablecoin trust depends on reserve backing and regulatory compliance, not just the peg mechanism itself.
How to read XRP price charts and volume data
Reading a price chart correctly separates informed traders from reactive ones. The horizontal axis on any XRP price chart represents the time horizon, ranging from minutes to years. Selecting the right time frame for your trading style is not optional. It is the foundation of every technical decision you make.
Volume bars sit beneath the price chart and are equally important. Higher volume confirms market conviction behind a price move. A price spike on low volume is a warning sign, not a signal to act.
Practical steps for chart interpretation
- Identify the trend on a higher time frame first. Check the daily or weekly chart before zooming into hourly data.
- Match volume to price direction. Rising price with rising volume is a confirmed move. Rising price with falling volume suggests the move may reverse.
- Watch for volume divergence. When price makes a new high but volume declines, the trend is losing strength.
- Avoid overtrading intraday noise. Most short-term XRP price fluctuations do not represent tradeable trends.
The table below shows how volume context changes the interpretation of a price move:
| Price Move | Volume Level | Interpretation |
|---|---|---|
| Price rises 3% | High volume | Strong buying conviction, trend likely valid |
| Price rises 3% | Low volume | Weak move, possible false breakout |
| Price drops 4% | High volume | Significant selling pressure, trend may continue |
| Price drops 4% | Low volume | Likely short-term noise, watch for recovery |
Understanding trading volume analysis in this context helps you avoid acting on signals that lack real market backing.
Pro Tip: Apply the Relative Strength Index (RSI) alongside volume analysis on XRP charts. The RSI measures momentum and can flag overbought or oversold conditions before a price reversal occurs. Tickerplace's RSI guide walks through the mechanics clearly.
What recent market data shows about XRP price trends in 2026
The current ripple price trend in 2026 reflects a market that is liquid but range-bound near the $1.10 level. The 24-hour trading range recently sat between $1.09 and $1.14 USD, a relatively tight band that signals consolidation rather than a directional breakout.
Daily trading volume tells a more active story. XRP daily volume on Kraken reached approximately 1.8 billion tokens, worth close to $2 billion USD. That level of liquidity means large orders can be filled without significant slippage, which is a meaningful advantage for institutional traders.
Key data points from the current market environment:
- Current price: Approximately $1.10 USD per XRP token
- 24-hour range: $1.09 to $1.14 USD
- Daily trading volume: $1.5 billion to $1.9 billion USD
- Market capitalization: Approximately $68 billion USD
- Circulating supply: Roughly 62 billion XRP tokens
XRP has traded at all-time highs well above its current price, which means the current ripple price forecast depends heavily on whether broader crypto market conditions improve. The $1.10 range represents a significant discount from historical peaks, which some traders view as a long-term accumulation opportunity. Others treat it as a sign that the asset has found a new equilibrium. Volume data at these levels does not yet confirm a strong directional bias in either direction.
Key takeaways
The XRP price in USD is determined by market forces, trading volume, and sentiment, while RLUSD is a separate stablecoin that holds a fixed $1.00 value and serves an entirely different investment purpose.
| Point | Details |
|---|---|
| Current XRP price | XRP trades near $1.10 USD with a daily range of $1.09 to $1.14. |
| Volume confirms trends | High trading volume validates price moves; low-volume moves are unreliable signals. |
| XRP vs. RLUSD | XRP is volatile and market-driven; RLUSD is a stablecoin pegged 1:1 to the dollar. |
| Chart time frames matter | Always check a higher time frame before acting on short-term price data. |
| Market cap context | XRP's $68 billion market cap and 62 billion circulating tokens shape its price behavior. |
Tickerplace's take on trading the XRP price
The most common mistake traders make with XRP is treating a single price quote as sufficient context. Checking "how much is ripple" and seeing $1.10 tells you almost nothing on its own. What matters is whether that $1.10 is supported by volume, whether it sits above or below key moving averages, and whether the broader crypto market is in a risk-on or risk-off posture.
The XRP and RLUSD confusion is also more widespread than most traders realize. Tickerplace has seen investors allocate capital to RLUSD expecting XRP-style appreciation, then wonder why their position barely moves. The two assets serve fundamentally different roles. XRP is a speculative and utility asset. RLUSD is a dollar proxy. Mixing up their expected behavior is a portfolio management error that costs real money.
For long-term investors, the ripple price trend near $1.10 with $68 billion in market cap suggests the asset has institutional credibility but has not yet recaptured its historical highs. That gap between current price and prior peaks is either an opportunity or a warning, depending on your time horizon and risk tolerance. Short-term traders should focus on volume confirmation and RSI signals rather than price targets alone. The data is available. The discipline to use it correctly is what separates consistent traders from reactive ones.
— Tickerplace
Track XRP and ripple USD price with Tickerplace
Monitoring the XRP price in USD requires more than a single number. You need real-time data, volume charts, and technical analysis tools working together.

Tickerplace provides all of that in one place. The platform delivers real-time market data, price trend charts, and screening tools that help you track XRP alongside other assets in your portfolio. Whether you are evaluating the current ripple value for a new position or monitoring an existing one, Tickerplace gives you the data depth to make that call with confidence. Visit Tickerplace to access market analysis tools built for serious traders and investors. You can also use the stock screener to filter and compare crypto and equity assets side by side.
FAQ
What is the current ripple price in USD?
As of June 2026, the XRP price is approximately $1.10 USD, with a 24-hour trading range between $1.09 and $1.14 USD.
What is the difference between XRP and ripple USD (RLUSD)?
XRP is a volatile cryptocurrency whose price is set by market trading activity. RLUSD is a stablecoin issued by Ripple Labs and pegged 1:1 to the US dollar, designed to hold a stable value near $1.00.
How much is ripple's total market capitalization?
XRP's market cap is approximately $68 billion USD, supported by a circulating supply of roughly 62 billion tokens.
How do i use volume to confirm an XRP price trend?
A price move accompanied by high trading volume signals strong market conviction and is more likely to continue. A price move on low volume is a weaker signal and may reverse quickly.
What is a realistic ripple price forecast for 2026?
No forecast is guaranteed, but XRP's current consolidation near $1.10 with daily volumes near $1.9 billion suggests the market is liquid and stable. A directional breakout would require sustained volume above recent averages to be considered credible.