
TL;DR:
- Market liquidity is a multidimensional characteristic involving bid-ask spreads, order book depth, price impact, and resiliency that affect trading costs. Managing liquidity requires assessing all these dimensions simultaneously, especially when executing large or urgent trades, as surface metrics can be misleading. Regulatory and systemic factors influence market liquidity, making ongoing analysis essential for effective portfolio construction and risk management.
Market liquidity is defined as the ease and cost of converting an asset into cash quickly without causing a significant change in its price. This concept sits at the core of every trading and investment decision you make, whether you are managing a retail portfolio or executing institutional block orders. The New York Fed operationalizes this for U.S. Treasury notes using high-frequency interdealer data, measuring bid-ask spreads, order book depth, and price impact during New York trading hours. Understanding these dimensions is not optional for serious market participants. It is the foundation for controlling execution costs, managing risk, and building portfolios that hold up under pressure.
Defining market liquidity: dimensions and metrics
Liquidity is multi-dimensional by nature, and collapsing it into a single number like trading volume produces a dangerously incomplete picture. Four distinct dimensions together define how usable a market actually is for your purposes.

| Metric | What it measures | Why it matters |
|---|---|---|
| Bid-ask spread (tightness) | Cost of an immediate round-trip trade | Directly reduces net return on every transaction |
| Order book depth | Quoted size available near the mid-price | Indicates how much you can trade before price moves |
| Price impact | Price change caused by executing a trade | Determines real execution cost for larger orders |
| Resiliency | Speed at which prices recover after a trade | Signals how quickly the market resets to fair value |
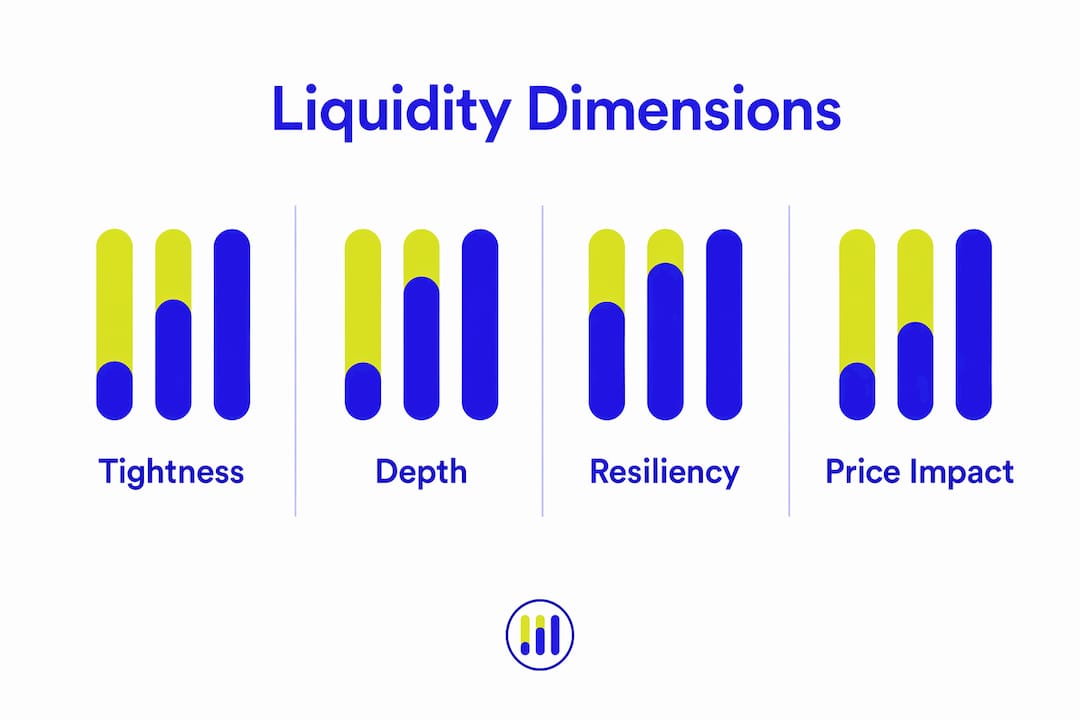
Each dimension captures a different friction. Tightness tells you the minimum cost of entry and exit. Depth tells you how far that cost holds before the order book thins out. Price impact quantifies the slippage you absorb when your order is large relative to available supply. Resiliency tells you whether the disruption you caused is temporary or persistent.
The U.S. Treasury market provides a clear real-world illustration. Liquidity deteriorated sharply around April 2, 2025, with wider spreads, reduced depth, and elevated price impact per $100 million traded. By early 2026, those metrics had reverted to low levels. This episode demonstrates that liquidity is dynamic, not static, and that resiliency is as informative as the other three dimensions.
Pro Tip: Always assess liquidity across all four dimensions simultaneously. A tight spread with shallow depth is not a liquid market for any order above a minimal size.
How does market microstructure affect execution quality?
Liquidity reflects the market's capacity to absorb order flow with limited price disruption, and that capacity varies dramatically depending on order size. Quoted prices can mislead if meaningful size cannot be traded at the displayed price. The top of the order book may show a $0.01 spread, but that spread applies only to the quantity quoted at the best bid and offer.
The distinction between visible quotes and executable liquidity is where most execution errors originate. Consider the difference between a retail order for 500 shares of a large-cap S&P 500 constituent versus an institutional order for 500,000 shares of the same stock. The retail order executes at the quoted spread. The institutional order consumes multiple price levels, triggering price impact that can far exceed the quoted spread in cost terms.
- Execution horizon matters. A trader who can work an order over several hours faces lower price impact than one who needs to fill immediately. Liquidity tied to execution horizon and risk units gives a far more realistic cost estimate than any single snapshot metric.
- Resiliency determines recovery. After a large order moves the price, a resilient market returns to its pre-trade level quickly. A fragile market stays disrupted, increasing the cost of any subsequent trades.
- Volume is not liquidity. High turnover in a market does not guarantee that large orders can be absorbed without slippage. Displayed metrics like spread and depth can appear favorable at the top of the order book but deteriorate rapidly with larger order sizes.
Pro Tip: Before executing a large position, check order book depth at multiple price levels, not just the best bid and offer. The difference between quoted and executable liquidity can be substantial.
For context on how trading volume relates to but differs from true liquidity, the distinction is worth examining carefully before sizing any position.
What risks arise from liquidity mismatches and regulation?
Liquidity risk extends beyond individual trade execution. At the systemic level, liquidity mismatch in open-ended funds creates run dynamics when redemption terms are more favorable than the liquidity of the underlying assets. The Bank of England identifies this mismatch as a structural amplifier of stress: when one investor redeems early, remaining investors face a worse liquidity position, creating an incentive for others to follow.
Liquidity and funding liquidity risks are networked. A deterioration in market liquidity raises the cost of funding positions, which forces asset sales, which further reduces market liquidity. This feedback loop is not a theoretical concern. It has played out in multiple stress episodes across global markets.
Regulatory frameworks address these risks through several mechanisms:
- Liquidity Coverage Ratio (LCR). The LCR requires banks to hold sufficient high-quality liquid assets to cover net cash outflows over a 30-day stress period. LCR regulation causally reduces banks' wholesale funding costs, particularly for longer-dated instruments, improving the stability of bank funding structures.
- Liability maturity management. Banks with greater LCR exposure shifted toward longer maturity liabilities, reducing rollover risk and contributing to more stable market liquidity conditions.
- Redemption management tools. Regulators increasingly require open-ended funds to hold liquidity buffers or use swing pricing to reduce first-mover redemption incentives.
- Stress testing. Supervisory frameworks require institutions to model liquidity under adverse scenarios, not just normal conditions.
For investors, these regulatory dynamics matter because balance-sheet liquidity regulation translates directly into market outcomes. When banks fund more stably, they can provide more consistent market-making capacity, which supports tighter spreads and deeper order books across asset classes. You can use the current ratio calculator to assess a company's short-term liquidity position as part of a broader risk evaluation.
How to apply liquidity analysis to investment decisions
Applying a rigorous understanding of market liquidity to your investment process requires moving beyond the question of whether you can trade to the question of what it costs to trade at your required size and speed.
- Monitor all four dimensions. Track bid-ask spreads, order book depth, price impact estimates, and resiliency indicators for every asset class in your portfolio, not just equities.
- Adjust position sizing to liquidity. Size positions relative to average daily volume and order book depth so that your exit does not itself become a source of price impact.
- Stress-test under adverse conditions. Normal-market liquidity metrics understate the cost of exiting positions during periods of stress. Model your portfolio's liquidity under a scenario where spreads widen and depth halves.
- Account for liquidity in asset allocation. Illiquid assets may offer return premiums, but those premiums must compensate for the real cost of being unable to exit without significant price concession.
- Watch regulatory and structural changes. Shifts in LCR requirements, fund redemption rules, or market-making regulations can alter liquidity conditions across entire asset classes with little warning.
Pro Tip: Set alerts for unusual changes in bid-ask spreads or order book depth around major economic data releases, central bank decisions, or regulatory announcements. These events are when liquidity deteriorates fastest and execution costs spike.
Key takeaways
Market liquidity is best understood as a multidimensional execution cost, not a binary condition, and managing it requires tracking bid-ask spread, depth, price impact, and resiliency together.
| Point | Details |
|---|---|
| Liquidity is multidimensional | Bid-ask spread, depth, price impact, and resiliency each capture distinct trading frictions. |
| Volume does not equal liquidity | High turnover can coexist with poor executable liquidity for large order sizes. |
| Regulatory frameworks shape liquidity | LCR rules reduce bank funding costs and influence market-making capacity across asset classes. |
| Systemic risk from mismatches | Liquidity mismatch in open-ended funds creates run dynamics that amplify market stress. |
| Apply liquidity to portfolio construction | Size positions, time execution, and stress-test under adverse liquidity scenarios before committing capital. |
Tickerplace's perspective on liquidity as a living metric
The most persistent mistake Tickerplace observes among investors is treating liquidity as a fixed property of an asset rather than a condition that shifts with market structure, regulatory environment, and order flow dynamics. The April 2025 Treasury market episode is a useful reminder: even the deepest and most actively traded government bond market in the world can see its liquidity metrics deteriorate sharply within days.
The second common misunderstanding is equating a tight spread with adequate liquidity. Tickerplace has seen this assumption cause real execution damage when investors attempt to exit positions of meaningful size in markets that look liquid at the surface but have thin books below the best bid and offer.
The regulatory dimension is underappreciated by most retail and many institutional investors. LCR requirements, fund redemption rules, and stress-testing mandates are not abstract compliance exercises. They directly shape who provides liquidity, at what cost, and under what conditions. Investors who track these regulatory shifts gain a structural edge in anticipating where liquidity conditions will tighten or ease.
The practical takeaway is to treat liquidity analysis as an ongoing discipline, not a one-time check. Build it into your pre-trade process, your portfolio review, and your risk management framework. The cost of ignoring it shows up in execution slippage, forced exits at poor prices, and portfolios that cannot be repositioned when conditions change.
— Tickerplace
Research and monitor liquidity with Tickerplace
Tickerplace provides the market data, screening tools, and financial analysis resources you need to evaluate liquidity conditions across global equities and make better-informed trading decisions.

The Tickerplace stock screener lets you filter equities by trading metrics, market capitalization, and financial ratios, helping you identify positions where liquidity conditions align with your execution requirements. For deeper fundamental analysis, the Tickerplace research platform gives you access to company financials, price history, and technical indicators across global markets. Whether you are sizing a new position or stress-testing an existing one, Tickerplace puts the data you need in one place.
FAQ
What is the standard definition of market liquidity?
Market liquidity is defined as the ease and cost of converting an asset into cash quickly without causing a significant price change. It is measured through bid-ask spread, order book depth, price impact, and resiliency.
Why is volume not a reliable measure of liquidity?
High trading volume does not guarantee that large orders can be executed without significant price impact. Displayed metrics like spread and depth can deteriorate rapidly once order size exceeds the quantity quoted at the best bid and offer.
How does the Liquidity Coverage Ratio affect market liquidity?
LCR regulation causally reduces banks' wholesale funding costs and encourages longer liability maturities, which supports more stable market-making capacity and tighter spreads across asset classes.
What is liquidity mismatch risk in funds?
Liquidity mismatch occurs when an open-ended fund offers redemption terms more favorable than the liquidity of its underlying assets. The Bank of England identifies this as a source of run dynamics that amplify stress across financial markets.
How should investors incorporate liquidity into portfolio construction?
Investors should size positions relative to order book depth and average daily volume, stress-test exit costs under adverse conditions, and account for liquidity premiums when allocating to less liquid asset classes.