
TL;DR:
- The AUD/THB exchange rate reflects currency movements driven by commodity exports and tourism data. Traders should consider mid-market rates, regional economic factors, and timing around central bank announcements for better results. Recognizing the true costs of markup spread helps optimize trading strategies in 2026.
The AUD/THB exchange rate defines how many Thai baht one Australian dollar can buy, making it a core metric for forex traders and investors tracking currency movements between Australia and Thailand. In june 2026, the Australian dollar Thai baht pair traded in a range of 23.10 to 23.49 THB per AUD, reflecting the pair's sensitivity to commodity markets, central bank policy, and regional economic data. Tools like Wise and TransferGo publish mid-market benchmarks for this pair, while platforms like Tickerplace provide the broader market context traders need to act on those numbers.
What does the AUD THB rate look like in 2026?
The AUD/THB currency pair showed clear volatility in early june 2026, with the rate peaking at 23.49 and dipping to 23.10, producing a weekly average of approximately 23.29 THB per AUD. That range is narrow in absolute terms but significant for traders working with large notional positions or tight margins.

| Metric | Value (June 2026) |
|---|---|
| High | 23.4489 THB |
| Low | 23.1019 THB |
| Average | 23.2898 THB |
| Largest 24-hr move | 0.241% decrease (june 5) |
The largest intraday move recorded was a 0.241% decrease on june 5, 2026. That figure matters because it sets a realistic expectation for daily price swings. Traders who size positions assuming larger moves will find themselves overexposed; those who ignore even small moves on leveraged accounts face meaningful drawdown risk.
Seasonal factors also shape this pair. Australia's commodity export cycle and Thailand's tourism seasons both create recurring periods of elevated volatility. Tracking those cycles alongside real-time rate data gives traders a structural edge.
Pro Tip: Set price alerts at the recent high of 23.45 and low of 23.10 to catch breakout moves before they fully develop.
Which economic factors drive AUD/THB movements?
The Australian dollar and the Thai baht each respond to a distinct set of economic drivers, and understanding both sides of the pair is non-negotiable for informed trading.
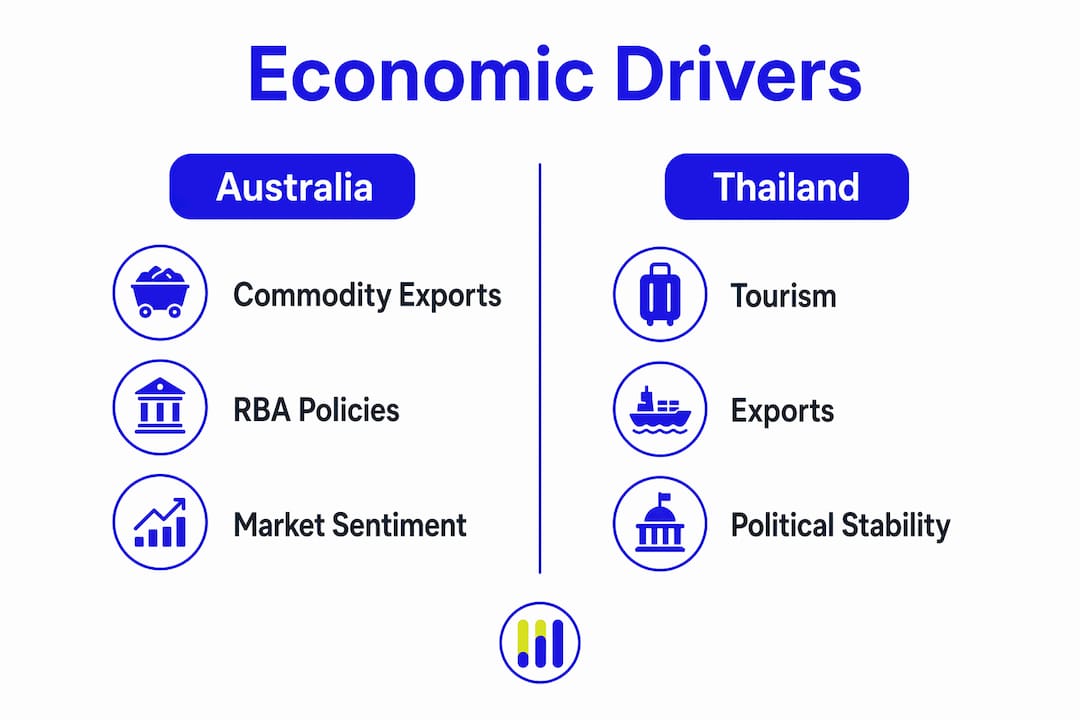
Drivers of the Australian dollar (AUD):
- Iron ore and coal exports are the primary commodity anchors for AUD. When global demand for these materials rises, AUD strengthens. When it falls, AUD weakens. Traders tracking Fortescue Metals Group (FMG) stock price movements get an early read on iron ore sentiment.
- Reserve Bank of Australia (RBA) policy announcements create distinct liquidity windows and volatility spikes in AUD pairs. Rate decisions and forward guidance from the RBA move AUD faster than almost any other domestic event.
- Australian GDP, employment data, and trade balance figures all feed into AUD valuation. Strong export data typically lifts AUD against most Asian currencies, including THB.
Drivers of the Thai baht (THB):
- Thailand's tourism and export data directly influence THB strength. A surge in tourist arrivals or a strong export quarter pushes THB higher, compressing the AUD/THB rate.
- Thai central bank (Bank of Thailand) interest rate decisions and inflation data move THB in the same way RBA decisions move AUD.
- Regional risk sentiment across Southeast Asia also affects THB. During periods of broad emerging market stress, THB tends to weaken relative to commodity currencies like AUD.
Time zone differences between Australia and Thailand create specific liquidity windows traders should target. The Sydney open and the overlap with Bangkok business hours produce the highest volume periods for this pair. Missing those windows means trading in thinner markets with wider spreads.
How do mid-market rates differ from retail AUD to THB rates?
The mid-market rate is the true midpoint between the buy and sell prices for a currency pair. No retail trader or bank customer receives this rate directly. Every provider adds a markup on top of it.
Retail forex rates for the Australian dollar Thai baht conversion typically deviate from the mid-market rate by 2%–5% due to hidden spreads and commissions. On a 100,000 AUD transaction, a 3% markup costs 3,000 AUD in lost value. That cost is invisible unless you compare the offered rate against the mid-market benchmark.
Here is how the rate gap plays out across common provider types:
- Online converters (Wise, TransferGo): Display the mid-market rate as a reference. Actual transfer rates include a transparent fee, usually lower than banks.
- Retail banks: Rates from banks often carry extra fees or spreads, possibly deviating 2%–5% from mid-market pricing. The markup is embedded in the quoted rate, not listed separately.
- Airport kiosks and exchange bureaus: Consistently offer the worst rates. Markups frequently exceed 5% and are rarely disclosed upfront.
- Forex brokers: Spreads vary widely by broker and account type. ECN brokers typically offer tighter spreads than market makers for exotic pairs like AUD/THB.
No single exchange rate applies uniformly across all providers. The rate you receive depends on the provider, transaction size, and account relationship. Treating any quoted rate as fixed is a costly assumption.
Pro Tip: Always compare your provider's quoted AUD/THB rate against the current mid-market rate on Wise before executing a large transaction. The difference is your real cost.
What strategies help traders optimize AUD/THB positions?
Effective trading of the AUD/THB pair requires timing, data discipline, and a clear understanding of cost structures. The following practices separate consistent traders from reactive ones.
- Time entries around RBA and Bank of Thailand announcements. Central bank announcements and economic releases in both countries create liquidity windows with greater volatility. These windows offer both opportunity and risk. Entering a position 30 minutes before a major announcement without a defined stop is a common and expensive mistake.
- Use historical rate data to set realistic targets. Historical data and volatility inform timing strategies for entry and exit points. The june 2026 range of 23.10 to 23.49 provides a near-term reference for support and resistance levels.
- Account for spread costs before calculating profit targets. A trade that looks profitable at mid-market rates may break even or lose money once the 2%–5% retail markup is factored in.
- Monitor commodity price indexes alongside the AUD/THB rate. Iron ore futures and coal spot prices are leading indicators for AUD direction. A sustained drop in iron ore prices typically precedes AUD weakness by one to three trading sessions.
| Factor | Impact on AUD/THB |
|---|---|
| Rising iron ore prices | AUD strengthens, rate rises |
| Strong Thai tourism data | THB strengthens, rate falls |
| RBA rate hike | AUD strengthens, rate rises |
| Bank of Thailand rate cut | THB weakens, rate rises |
| Broad emerging market selloff | THB weakens, AUD holds or rises |
Tickerplace provides real-time data on Australian equities like FMG stock, which traders use as a proxy for iron ore sentiment before positioning in AUD pairs. Pairing equity signals with forex rate data produces more informed entry decisions than using either source alone.
Key takeaways
The AUD/THB pair is driven by Australia's commodity exports and Thailand's tourism economy, and traders who ignore mid-market rate markups of 2%–5% will consistently underperform their theoretical returns.
| Point | Details |
|---|---|
| June 2026 rate range | AUD/THB traded between 23.10 and 23.49, averaging 23.29 THB per AUD. |
| Commodity prices drive AUD | Iron ore and coal export data are the primary leading indicators for AUD direction. |
| THB responds to tourism | Strong Thai tourism and export figures push THB higher, compressing the AUD/THB rate. |
| Retail markups erode returns | Banks and kiosks add 2%–5% above mid-market rates, cutting into trade profitability. |
| Time entries strategically | RBA and Bank of Thailand announcements create the highest-volatility windows for this pair. |
Tickerplace's take on trading AUD/THB in 2026
The pair's behavior in june 2026 confirmed something Tickerplace has observed consistently: the AUD/THB rate does not move in isolation. Every significant shift in the rate traced back to either a commodity price event or a central bank signal. The 0.241% single-day drop on june 5 aligned with broader risk-off sentiment in commodity markets, not a Thailand-specific event.
The traders who navigate this pair well are the ones who treat it as a commodity-linked currency pair first and a bilateral exchange rate second. Watching iron ore futures on the Singapore Exchange or tracking ANZ's market commentary gives you a forward view that pure forex charts cannot provide. The mid-market rate misconception remains the most damaging blind spot. Traders who benchmark their execution against mid-market rates catch markup costs early and negotiate better terms with brokers. Those who skip that step often attribute underperformance to market timing when the real culprit is spread cost. Cautious optimism is the right posture for this pair in 2026. Volatility is present but contained. The structural drivers are well understood. Traders who respect the data and manage costs will find consistent opportunity here.
— Tickerplace
Tickerplace tools for AUD/THB investors
Tracking the Australian dollar Thai baht pair requires more than a currency converter. It requires visibility into the commodity markets and equity signals that move AUD before the forex rate catches up.

Tickerplace delivers real-time market data on Australian equities, indices, and commodity-linked stocks that directly influence AUD direction. Traders can use the stock screener to filter for iron ore and resources companies, then cross-reference price movements with AUD/THB rate shifts to identify high-probability entry windows. The platform's research tools and financial metrics give investors the full picture, from equity fundamentals to market-wide sentiment, in one place.
FAQ
What is the current AUD to THB exchange rate?
In june 2026, 1 AUD exchanged for approximately 23.10 to 23.49 THB, with a weekly average near 23.29 THB. Rates update continuously, so check a live source like Wise for the current mid-market value.
How do I convert AUD to THB accurately?
Use a mid-market rate tool like Wise as your benchmark, then compare your provider's quoted rate against it. The gap between the two is your real transaction cost.
What moves the AUD/THB rate the most?
Iron ore and coal prices are the strongest drivers of AUD, while Thai tourism and export data most influence THB. RBA policy announcements also produce sharp short-term moves in the pair.
Why is the rate I receive different from what I see online?
Online converters display the mid-market rate, which includes no fees. Banks and exchange services add a markup of 2%–5%, so the rate you receive is always less favorable than the published benchmark.
Is AUD/THB a good pair for forex trading?
AUD/THB offers clear fundamental drivers and measurable volatility, making it suitable for traders who monitor commodity markets and central bank calendars. Liquidity is lower than major pairs, so spreads are wider and position sizing requires more care.