
TL;DR:
- Westpac's stock price reflects sector sentiment, dividend policy, and broader market conditions, influencing its income appeal.
- Its fully franked dividend and grossed-up yield make it a competitive, reliable income stock, but understanding mechanical price adjustments is crucial.
Westpac Banking Corporation (WBC) is currently trading at approximately A$35.59 per share on the ASX, with a market capitalization of around $121.7 billion, making it one of Australia's four major banks and a fixture in income-focused portfolios. The WBC share price reflects a confluence of dividend policy, sector sentiment, and broader market conditions that every serious investor needs to understand before making a position decision. With a fully franked interim dividend payable in June 2026 and analyst consensus pointing to a full-year payout of 155 cents per share, WBC carries real income appeal. This guide breaks down what the current price means, how dividends affect it, and how to use that information to trade or invest more precisely.
What does the WBC share price tell you right now?
The WBC share price closed at approximately A$35.59 on June 2, 2026, with an intraday range of A$35.11 to A$35.89. That range tells you the market is actively pricing in near-term uncertainty, particularly around the post-ex-dividend period and broader Australian banking sector conditions. At this price level, Westpac's market cap sits near $121.7 billion, placing it firmly in blue chip territory on the ASX. Think of blue chip stocks like the blue chips in poker: they carry the highest face value and are treated as the most reliable assets at the table.
![]()
For income investors, the current price is the denominator in every yield calculation. Small movements in the share price translate directly into meaningful shifts in forward yield estimates. A drop from $36 to $35 on a fixed annual dividend of 155 cents per share moves the forward yield from approximately 4.3% to 4.4%, which sounds minor but compounds significantly across a large holding.
Pro Tip: Prices on many financial data platforms, including Intelligent Investor, are delayed by at least 20 minutes. Never use a delayed feed to make intraday entry or exit decisions on WBC shares.
How dividends affect WBC share price and yield
Westpac declared a fully franked interim dividend of 77 cents per share, payable on June 26, 2026, with the ex-dividend date falling in May 2026. Fully franked means the dividend carries a 30% company tax credit attached, which Australian resident investors can use to offset their personal tax liability. This distinction matters enormously when comparing WBC's income against other asset classes or international stocks that offer no franking.
On the ex-dividend date, the WBC share price adjusts mechanically downward by approximately the cash dividend value. This is not a sign of fundamental deterioration. It is a mechanical price adjustment that reflects the fact that buyers after that date are no longer entitled to the upcoming payment. Retail investors frequently misread this drop as a bearish signal and sell at exactly the wrong moment.
Here is what the yield picture looks like at current prices:
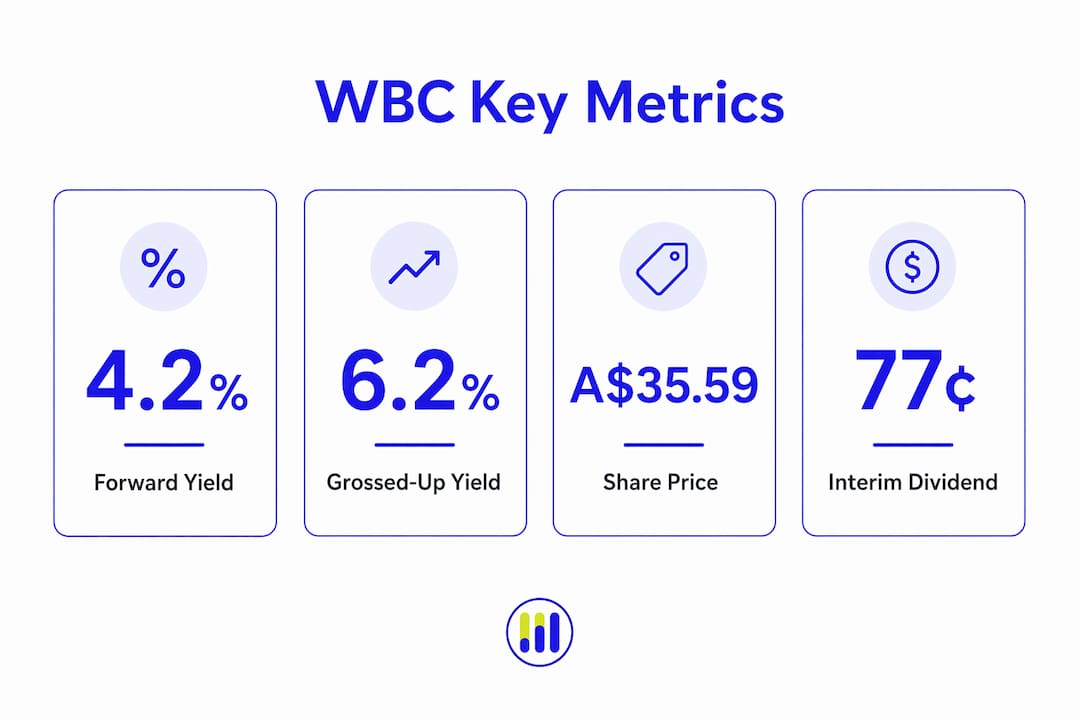
- Cash dividend yield: approximately 4.2% forward fully franked, based on a ~$36 share price
- Grossed-up yield: approximately 6.2% when franking credits at the 30% corporate tax rate are included
- Payout ratio: 77.1%, flat half-on-half, with a slight year-over-year increase
- Consensus full-year FY2026 dividend: 155 cents per share, implying a 4.3% forward fully franked yield
The grossed-up yield of 6.2% is the figure that matters most for Australian taxpayers in higher brackets. It represents the true pre-tax income equivalent of holding WBC shares, and it is the number you should use when comparing yields across different asset classes.
Pro Tip: Always compare WBC's grossed-up yield against other ASX bank yields on the same basis. Mixing cash yields with grossed-up yields produces misleading conclusions about relative income value.
Recent WBC share price trends and what drove them
WBC shares declined from near A$43 in April 2026 to around A$36 by the end of May 2026, a drop of roughly 16% from prior highs and a year-to-date decline of approximately 7.8%. That kind of movement in a major bank stock reflects more than just dividend mechanics. Sector-wide pressure on Australian financials, shifting interest rate expectations, and profit-taking after a strong prior run all contributed to the pullback.
The table below summarizes the key price movements over the recent period:
| Period | Approximate WBC Price | Key Driver |
|---|---|---|
| April 2026 peak | ~A$43.00 | Strong sector momentum |
| End of May 2026 | ~A$36.00 | Sector correction, ex-dividend adjustment |
| June 2, 2026 close | ~A$35.59 | Post-ex-dividend trading, market sentiment |
This price compression actually improved the forward yield for new buyers entering after the correction. Investors who purchased near $43 are now sitting on a capital loss but receiving the same absolute dividend income. That asymmetry is worth tracking carefully if you are considering adding to a position.
Pro Tip: For intraday WBC price tracking, use a platform with live ASX data rather than delayed feeds. The difference between a 20-minute-old price and the current bid can be material during volatile sessions.
Practical steps for trading and investing in WBC shares
Translating WBC price data and dividend information into a coherent strategy requires a structured approach. The following steps apply whether you are building an income position or trading around price movements:
- Confirm the ex-dividend date before entering. Buying just before the ex-dividend date means you receive the dividend but also absorb the mechanical price drop. Buying just after means you get a lower entry price without the upcoming payment. Neither is inherently better; the choice depends on your tax position and holding horizon.
- Use grossed-up yield, not cash yield, for income comparisons. The raw cash yield understates WBC's income value for Australian resident taxpayers. Always gross up for franking credits before benchmarking against term deposits or unfranked dividends.
- Cross-check prices across multiple sources. Platforms like Google Finance and Intelligent Investor both carry WBC data, but delays vary. Use at least two sources and treat any price more than five minutes old as a reference, not a live quote.
- Benchmark against peer banks before committing capital. Comparing WBC's valuation and yield against CBA and ANZ gives you a relative sense of whether the current price represents fair value or a discount.
- Run dividend income scenarios before sizing your position. A dividend income calculator that accounts for franking credits will show you the actual after-tax cash flow from a given holding size, which is far more useful than a headline yield percentage.
How does WBC compare to CBA and ANZ?
Contextualizing the WBC share price against its closest peers clarifies whether the current valuation is attractive or stretched. The table below provides a snapshot comparison across the three major ASX-listed banks as of mid-2026:
| Metric | WBC | CBA | ANZ |
|---|---|---|---|
| Approximate share price | ~A$35.59 | Higher (premium valuation) | Lower (discount to WBC) |
| Forward fully franked yield | ~4.2% | Lower yield at higher price | Broadly similar to WBC |
| Franking | 100% | 100% | 100% |
| Market cap | ~$121.7B | Largest ASX-listed bank | Smaller than WBC |
CBA consistently trades at a premium price-to-earnings multiple relative to WBC, reflecting its stronger retail banking franchise and lower credit risk perception. ANZ carries a different geographic exposure through its Asian operations, which introduces additional risk and return variables. For a deeper look at how CBA's share price has moved in 2026, or how ANZ compares on key metrics, those analyses provide useful benchmarks.
Pro Tip: When screening ASX banks for income, normalize all yields to a grossed-up basis before comparing. A 4.2% fully franked yield from WBC is not the same as a 4.2% unfranked yield from a non-bank stock.
Key takeaways
WBC's forward fully franked yield of approximately 4.2% (or 6.2% grossed up) makes it a competitive income stock, but only investors who understand ex-dividend mechanics and franking credit adjustments will interpret the price movements correctly.
| Point | Details |
|---|---|
| Current price snapshot | WBC closed at approximately A$35.59 on June 2, 2026, with a $121.7B market cap. |
| Dividend timing matters | The 77-cent interim dividend is payable June 26, 2026; ex-dividend date fell in May 2026. |
| Grossed-up yield is the real number | The 6.2% grossed-up yield is the accurate income measure for Australian taxpayers, not the 4.2% cash yield. |
| Recent price decline improved entry | WBC fell roughly 16% from April highs, raising the forward yield for new buyers entering at current levels. |
| Use live data for trading decisions | Delayed price feeds of 20-plus minutes make them unsuitable for intraday trading decisions on WBC. |
Tickerplace's take on reading WBC share price signals
The single most common mistake Tickerplace sees among retail investors in WBC shares is treating the ex-dividend price drop as a warning sign. It is not. It is arithmetic. The share price falls by roughly the dividend amount because buyers after that date are not entitled to the payment. Confusing a mechanical adjustment with a fundamental deterioration leads to poorly timed exits and missed income.
The second issue is yield comparison. Investors regularly benchmark WBC's 4.2% cash yield against term deposit rates or international dividend stocks without adjusting for franking credits. That comparison is structurally flawed. The grossed-up equivalent of 6.2% is the honest number, and it changes the income calculus significantly for investors in the 30% to 45% tax bracket.
The third issue is data quality. Delayed price feeds are fine for end-of-day portfolio reviews. They are not acceptable for intraday decisions. If you are trading WBC around earnings announcements or dividend dates, you need a live feed. The 20-minute delay on many free platforms is long enough to miss an entire intraday move in a volatile session.
The broader point is this: WBC is a well-understood, heavily analyzed stock. The edge for individual investors does not come from finding hidden information. It comes from interpreting publicly available data more carefully than the average retail participant.
— Tickerplace
Track WBC share price smarter with Tickerplace
Monitoring the WBC share price effectively requires more than a single data source. Tickerplace provides real-time ASX market data, a stock screener for filtering WBC and peer banks by yield, price movement, and valuation metrics, and a dedicated dividend income calculator that accounts for franking credits so you see your actual after-tax income projection.

Whether you are building a long-term income position in Westpac or trading around price movements, Tickerplace gives you the data infrastructure to make decisions grounded in current numbers rather than delayed snapshots. Visit Tickerplace to access live WBC share price data, run dividend scenarios, and screen the full ASX banking sector in one place.
FAQ
What is the current WBC share price?
As of June 2, 2026, WBC was trading at approximately A$35.59, with a day range of A$35.11 to A$35.89 and a market capitalization of around $121.7 billion.
What dividend is Westpac paying in June 2026?
Westpac declared a fully franked interim dividend of 77 cents per share, payable on June 26, 2026, representing a 77.1% payout ratio.
What is WBC's forward dividend yield?
The forward fully franked yield is approximately 4.2% at around $36 per share. Grossed up for franking credits at the 30% corporate tax rate, the yield is approximately 6.2%.
Why did the WBC share price fall in May 2026?
WBC shares declined from near A$43 in April 2026 to around A$36 by end of May 2026, a drop of roughly 16%, driven by sector-wide pressure, interest rate sentiment shifts, and the mechanical ex-dividend price adjustment.
Is delayed price data reliable for trading WBC shares?
Delayed price feeds are suitable for research and end-of-day portfolio review, but not for intraday trading. Platforms including Intelligent Investor report delays of at least 20 minutes, which makes real-time data sources necessary for active trading decisions.