
TL;DR:
- The share price reflects market consensus about a company's value, earnings potential, and risk, but does not guarantee a specific intrinsic worth.
- Investors should analyze historical trends, sector comparisons, and fundamental data to assess whether the current price accurately reflects NIB's long-term prospects.
Share price is one of the most visible numbers in any investor's research toolkit, yet it is also one of the most frequently misread. NIB Holdings Limited (ASX: NHF) trades on the Australian Securities Exchange and operates as one of the country's leading private health insurers. Many investors glance at the current price, form a quick opinion, and move on without ever asking what the number actually reflects. This article walks through what NIB's share price signals, how it has evolved over time, how it compares to sector peers, and what dividend patterns mean for your total return strategy.
Key Takeaways
| Point | Details |
|---|---|
| NIB price reflects market sentiment | The share price is shaped by market trends, company health, and investor demand. |
| Compare across ASX insurers | Benchmarking NIB against industry peers reveals strengths and potential risks. |
| Factor in dividends for total return | Dividend yields play a critical part in overall investor outcomes, not just price gains. |
| Analyze historical trends | Studying past price movements sharpens forecasts and investment strategy. |
| Look beyond share price alone | True insight comes from blending share price with fundamentals and qualitative analysis. |
Understanding NIB's share price: What does it represent?
A share price is not simply a price tag. It represents the market's collective judgment about a company's current value, future earnings potential, and risk profile, all compressed into a single number updated in real time throughout the trading day.
For NIB Holdings, the current NHF price is AU$6.900, reflecting conditions across both the company's fundamentals and the broader Australian equities market. That number is the result of millions of individual buy and sell decisions, each one expressing a view about NIB's prospects.
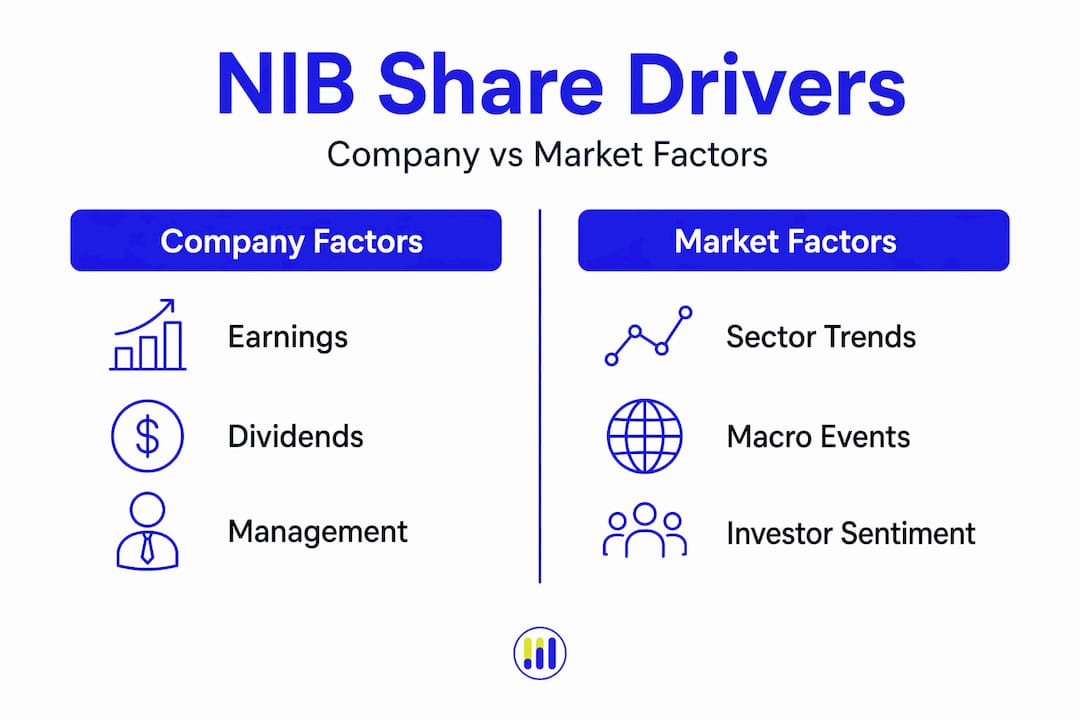
Several forces shape that price on any given day:
- Company financials: Revenue growth, net profit margins, claims ratios, and operating expenses all feed into earnings expectations. Reviewing NHF financial statements regularly keeps you aligned with the numbers behind the price.
- Investor sentiment: Broader risk appetite, macroeconomic news, and sector rotation can push prices up or down even when a company's underlying business is unchanged.
- Regulatory environment: The Australian private health insurance industry operates under specific government policy settings that can affect premium approval, participation rates, and profitability.
- Interest rates: Rising rates typically compress the price-to-earnings (P/E) multiples that investors are willing to pay, which weighs on share prices across the market, including NIB.
Key takeaway: The share price reflects consensus expectations, not certainty. A price of $6.90 does not confirm that NIB is worth exactly that amount; it simply means the market, at this moment, agrees on that figure. Your job as an investor is to evaluate whether that consensus is justified.
Short-term price moves often reflect noise rather than signal. Institutional rebalancing, macroeconomic surprises, and speculative trading can all push a price away from its fair value temporarily. Long-term price performance, measured over years rather than weeks, tends to track earnings and dividend growth far more reliably.
Recent trends and historical context for NIB Holdings
With the basics of the share price covered, let's see how NIB's price has evolved over time and how you can put those shifts in context.
NIB Holdings has gone through several distinct phases as a publicly listed company. The stock reached notable highs during periods of strong premium income growth and low claims inflation. Conversely, periods of elevated hospital utilization, regulatory uncertainty around private health insurance participation, or broad market sell-offs have created troughs. Understanding both extremes helps you frame the current $6.90 level accurately.
The table below provides a simplified view of how NIB's recent trading range compares across different periods:
| Period | Approximate price range | Key driver |
|---|---|---|
| 12-month high | ~AU$8.50 | Strong earnings and dividend growth |
| 12-month low | ~AU$5.80 | Broader ASX market correction |
| Current level | AU$6.90 | Recovery phase, cautious sentiment |
| 5-year average | ~AU$7.20 | Cycle-adjusted mean |
Note: Price data is approximate and for illustrative context. Always verify with live sources.
Analyzing this data requires a structured process. Here is a practical, step-by-step approach for using historical price data in your NIB research:
- Establish a baseline: Compare the current price against both the 12-month and 5-year average to gauge whether the stock is trading at a discount, premium, or near fair value.
- Overlay earnings events: Identify where major price movements coincided with half-year and full-year earnings announcements. This reveals how the market responds to NIB's actual financial delivery versus expectations.
- Assess volume patterns: High trading volumes during price moves are more significant than low-volume moves, which may reverse quickly.
- Use ASX historical data to contextualize: Compare NIB's price performance to the broader ASX 200 index to determine whether outperformance or underperformance is company-specific or market-wide.
- Cross-reference with sector news: Use platforms that aggregate NAB financial news and broader ASX coverage to ensure price moves are read alongside the macro backdrop.
Pro Tip: Do not evaluate NIB's price chart in isolation. Overlaying it with the XHJ (ASX Health sector index) reveals how much of the stock's movement is driven by sector tailwinds rather than NIB-specific fundamentals.
Comparing NIB to other ASX health insurers
Understanding broader industry context gives even deeper insight. Let's see how NIB stacks up next to other ASX health insurers.
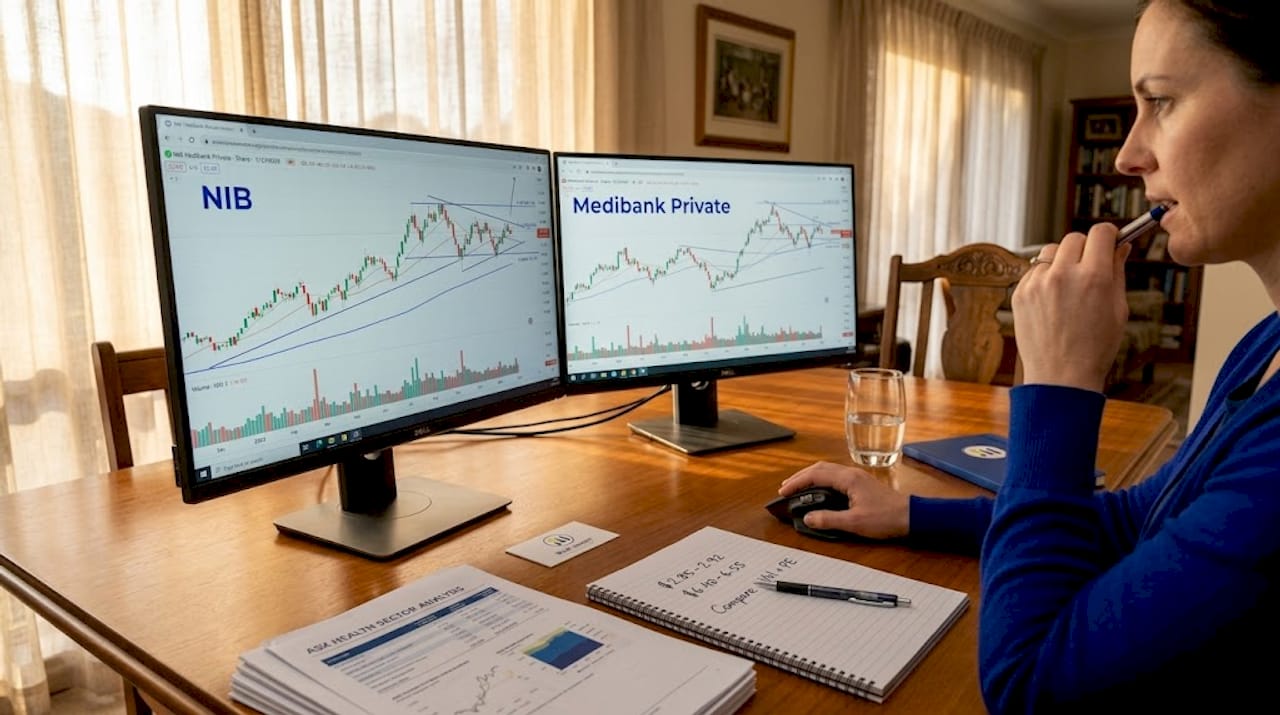
NIB competes primarily with Medibank Private (ASX: MPL) in the listed private health insurance space. Both companies serve similar markets, yet their valuations, growth trajectories, and capital management strategies differ in meaningful ways. Comparing these metrics gives you a clearer sense of whether NIB's current price of AU$6.90 represents good relative value.
| Metric | NIB Holdings (NHF) | Medibank Private (MPL) |
|---|---|---|
| Share price (approx.) | AU$6.90 | AU$3.80 |
| Market capitalization | ~AU$2.9B | ~AU$4.4B |
| P/E ratio (approx.) | ~17x | ~19x |
| Dividend yield (approx.) | ~4.5% | ~3.8% |
| International health ops | Yes (iihi) | Limited |
When evaluating this comparison, you need to look beyond surface-level price figures. NIB's lower absolute price does not make it cheaper in investment terms; what matters is the price relative to earnings, assets, and growth potential. Among the key comparative metrics to monitor:
- Claims ratio: The percentage of premium revenue paid out in claims; a lower ratio indicates better underwriting performance.
- Operating expense ratio: Measures administrative efficiency across the business.
- Net policyholder growth: A leading indicator of future premium revenue.
- International segment contribution: NIB's international health and travel operations add diversification that Medibank does not fully match.
- Capital return history: Buybacks and special dividends signal management's confidence in cash generation.
Pro Tip: When screening ASX listed companies in the insurance sector, filter by P/E ratio and dividend yield together rather than by price alone. This combination surfaces companies that are genuinely attractively valued rather than just inexpensive in nominal terms. Reviewing ASX financial statements alongside these filters sharpens the analysis further.
Dividend implications and investor returns
For many investors, dividends are a critical part of the total return. Here is what to know about NIB's dividends and what they mean for you.
NIB has maintained a consistent dividend payout history, distributing both interim and final dividends annually. At the current price of AU$6.90, the dividend yield is an important component of total return, particularly for income-focused portfolios and self-managed superannuation funds (SMSFs).
Key points every investor should understand about NIB's dividend profile:
- Payout ratio: NIB has historically maintained a payout ratio in the range of 60% to 70% of net profit after tax (NPAT), which signals a balance between rewarding shareholders and retaining capital for growth.
- Franking credits: As an Australian-listed company, NIB's dividends are typically fully franked, meaning Australian resident investors receive a tax offset that enhances the effective after-tax yield.
- Yield vs. price relationship: When NIB's share price falls, the prospective dividend yield rises (assuming dividends are maintained), which can attract income-focused investors and support the price during downturns.
- Dividend growth track record: A company that grows its dividend over time signals confidence in sustained earnings, which is a positive qualitative indicator alongside raw price data.
Use a dividend income calculator to model the exact cash flow a NIB position would generate at different share quantities and yield assumptions.
Pro Tip: Always model your total return as dividend yield plus capital growth, not either metric alone. A 4.5% yield on a stock that loses 10% of its value delivers a negative real return for that period.
What most investors overlook about NIB's share price
Let's address a common misconception that traps even experienced investors: the limits of focusing only on share price.
It is tempting to treat the NHF share price as a simple indicator of whether the company is performing well or poorly. This is a mistake. Share price can remain flat or even rise during periods when underlying business quality is deteriorating, simply because market sentiment is optimistic. Conversely, a stock can fall while the company posts solid earnings, purely due to sector rotation or macro fear.
What the share price does not tell you directly includes management quality and strategic execution, regulatory risks specific to Australian private health insurance, policyholder churn rates, the durability of NIB's international segment revenue, and competitive pricing pressure from not-for-profit health funds that operate outside the ASX-listed universe.
The strongest investors approach NIB as a multifactor analysis problem. Price anchors the analysis, but reviewing NHF financials in detail, tracking sector policy announcements from the Australian Government, assessing management communication in earnings calls, and comparing NIB's claims inflation against industry benchmarks round out a disciplined research process.
Share price alone is a starting point, not a conclusion. The investors who consistently outperform are those who understand what drives the price, not just where the price sits today.
Take your NIB share analysis further with Tickerplace
If you're ready to go beyond the basics and make data-driven NIB share decisions, here's how Tickerplace can help.
Tickerplace provides institutional-grade research tools accessible to individual investors and financial analysts. For NIB Holdings specifically, you can access up-to-date NIB financial statements including income statements, balance sheet data, and cash flow analysis, all in one place without needing multiple data subscriptions.

Beyond individual stock data, the Tickerplace stock screener tool allows you to filter across the entire ASX universe by metrics like dividend yield, P/E ratio, market capitalization, and sector classification. This makes it straightforward to build a comparative peer analysis for NIB or identify other ASX health sector opportunities that fit your portfolio criteria. Smarter research leads to more confident decisions.
Frequently asked questions
What is the current share price of NIB Holdings (NHF)?
The latest available data shows NIB Holdings trading at AU$6.90 per share, though this figure updates continuously during ASX trading hours.
How often does NIB's share price change?
NIB's share price fluctuates throughout every trading day as buy and sell orders are matched on the ASX, reflecting continuous market activity and shifting investor sentiment.
Where can I access NIB's financial reports and earnings news?
You can review NIB's financial statements and earnings updates directly on Tickerplace, which consolidates key data including income statements, balance sheet metrics, and analyst-relevant ratios in a single, organized interface.
How does NIB's dividend history affect its overall returns?
NIB's consistent dividend payments, including fully franked distributions, form a significant portion of total investor return, particularly for income-focused or SMSF investors who value the tax offset that franking credits provide.
Is share price alone enough to evaluate NIB as an investment?
No. Share price is a useful starting point but must be evaluated alongside earnings quality, claims ratios, dividend sustainability, sector dynamics, and management strategy to form a complete investment thesis.