
TL;DR:
- Nvidia's record revenue of $68.1 billion in Q4 FY2026 reflects rapid growth and AI market dominance. Its expanding data center segment and strong earnings justify high valuations, but investors must carefully assess sustainability and risk factors. Key upcoming events like the May 20 earnings release are vital for making informed investment decisions.
Nvidia's record Q4 FY2026 revenue of $68.1 billion, representing a 73% year-over-year surge, has pushed the company to the center of every serious investor's radar. Yet rapid growth and an equally rapid share price create a paradox: the stronger the numbers, the harder it becomes to separate genuine value from speculative momentum. For investors and analysts tracking NVDA, the challenge isn't finding data; it's knowing which signals to trust, which events to watch, and when to act with conviction rather than react to noise.
Key Takeaways
| Point | Details |
|---|---|
| Earnings drive price | Nvidia's surging revenue and record-breaking earnings are tightly linked with its recent stock price momentum. |
| Multiple factors affect price | Internal achievements and global market shifts both strongly influence Nvidia's stock value. |
| Valuation needs context | Comparing Nvidia's metrics to industry standards helps investors judge if the stock is overvalued. |
| Calendar matters | Tracking key events like earnings reports is essential for timing smarter investment moves. |
Understanding Nvidia's recent stock price performance
With Nvidia's financial fundamentals making headlines, let's look at how this translates into its stock price performance.
Nvidia's FY2026 results represent one of the most remarkable growth stories in the history of large-cap technology stocks. Full-year revenue reached $215.9 billion, up 65% year-over-year, a figure that would have seemed implausible even three years ago. That kind of top-line expansion tends to compress risk premiums in analyst models, pushing price targets higher and drawing institutional inflows that directly lift the share price.
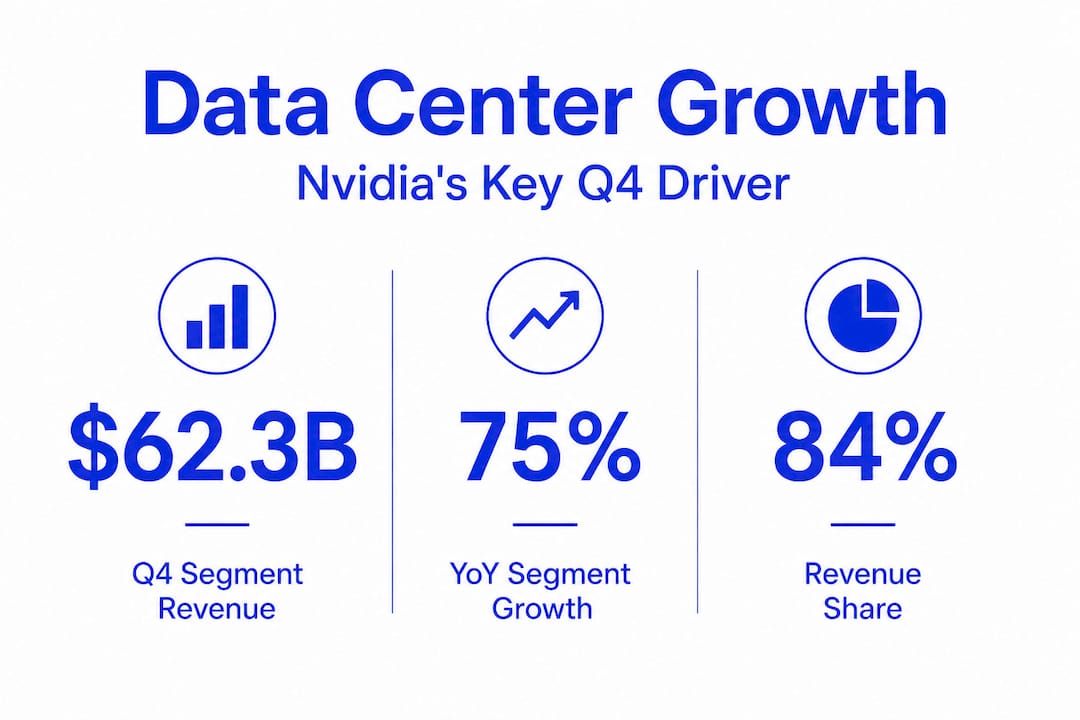
The data center segment is the single most important story within these results. At $62.3 billion in Q4 alone, it now represents the overwhelming majority of total revenue, and its 75% year-over-year growth rate signals that enterprise and hyperscale AI spending is still accelerating rather than plateauing. When one business unit grows at that velocity, it changes the entire valuation conversation.
Nvidia quarterly performance snapshot
| Metric | Q4 FY2025 | Q4 FY2026 | YoY Change |
|---|---|---|---|
| Total revenue | $39.3B | $68.1B | +73% |
| Data center revenue | $35.6B | $62.3B | +75% |
| Full-year revenue | $130.5B | $215.9B | +65% |
Several interconnected factors explain why Nvidia's valuation keeps expanding alongside its earnings:
- AI infrastructure dominance: Nvidia's GPU architecture remains the preferred compute platform for training and deploying large language models, giving it near-monopoly pricing power in the highest-growth segment of enterprise technology.
- Recurring demand cycles: Hyperscalers such as Microsoft Azure, Google Cloud, and Amazon Web Services continue to announce multibillion-dollar GPU procurement plans, creating visible forward revenue.
- Software and ecosystem lock-in: The CUDA software ecosystem makes switching to a competing hardware platform costly and time-consuming, reinforcing customer retention and pricing flexibility.
- Expanding end markets: Beyond cloud AI, Nvidia is gaining share in autonomous vehicles, robotics, and sovereign AI infrastructure, broadening its addressable market considerably.
For broader context on how revenue and balance sheet dynamics drive stock multiples, reviewing detailed company financials analysis helps illustrate how earnings momentum typically flows through to price performance across sectors.
Major factors influencing Nvidia's share price
While recent results have powered the price upward, what keeps the momentum going, and what could slow it down?
Nvidia's share price is never driven by a single variable. Internal catalysts and external pressures interact in ways that can amplify moves in either direction, sometimes within the same trading session. Understanding both layers is essential to reading price action with accuracy.
Internal drivers include quarterly earnings reports, gross margin trends, new product launches such as the Blackwell architecture rollout, and management guidance on forward revenue. Each of these creates discrete events around which institutional positioning shifts meaningfully.

External drivers are equally powerful. Macroeconomic conditions, particularly interest rate decisions from the Federal Reserve, affect how investors discount Nvidia's future earnings. Regulatory scrutiny around AI hardware exports to certain markets has already created notable price volatility, and that risk remains present. Competitive pressure from AMD, Intel, and emerging custom silicon from the hyperscalers themselves represents a slower-moving but structurally important threat.
Key influences on near-term price movement include:
- Export control regulations affecting chip sales to China and other restricted markets
- Hyperscaler capital expenditure guidance during their own earnings calls
- Supply chain capacity at TSMC, Nvidia's primary manufacturing partner
- New product announcement timelines and initial shipment volumes
- Broader risk-on or risk-off sentiment in equity markets
"Nvidia's next earnings release is scheduled for May 20, 2026, marking the next major inflection point for price direction. Investors should treat this date as a hard calendar event requiring portfolio review and position sizing decisions well in advance." Source: NVIDIA Q4 FY2026 earnings release
Pro Tip: Don't analyze Nvidia in isolation. Cross-reference its price behavior with today's market movements to determine whether a given price swing reflects company-specific news or a broader sector rotation. Misreading the source of a move leads to incorrect position sizing.
For a detailed framework on how to read both internal and external drivers together, the analysis of stock price drivers across high-growth technology names provides a directly transferable methodology.
How to analyze Nvidia's valuation in the current market
Now, to determine if today's price makes sense, investors need clear frameworks for valuation.
No single metric tells the full story for a company growing revenue at 65% annually. Nvidia's price-to-earnings ratio (P/E, the share price divided by earnings per share) looks elevated on a trailing basis; yet on a forward basis, rapid earnings growth compresses that multiple faster than in a typical large-cap stock. Price-to-sales ratio (P/S, market cap divided by total revenue) and PEG ratio (P/E divided by earnings growth rate) provide additional layers of context that prevent misleading conclusions.
Nvidia vs. semiconductor sector averages (illustrative)
| Metric | Nvidia (FY2026) | Semiconductor sector avg. | Interpretation |
|---|---|---|---|
| Revenue growth YoY | 65% | 12% | Significant premium justified |
| Forward P/E | ~30x | ~22x | Growth premium applied |
| Price-to-sales | ~25x | ~6x | High; reflects AI leadership |
| Gross margin | ~75% | ~50% | Superior pricing power |
To evaluate whether Nvidia's current price is justified or stretched, apply these steps in order:
- Anchor to growth rates first. Compare Nvidia's FY2026 revenue growth of 65% against sector peers. A premium multiple is only defensible if growth differentials support it.
- Calculate the PEG ratio. Divide the forward P/E by the expected earnings growth rate. A PEG below 1.0 generally suggests undervaluation; above 2.0 raises overvaluation flags even for high-growth names.
- Assess gross margin trajectory. Nvidia's roughly 75% gross margin signals strong pricing power. Any compression in this figure is a leading indicator of competitive pressure before it appears in revenue numbers.
- Stress-test with a bear-case scenario. Model what happens to the share price if revenue growth decelerates to 20 to 30% in FY2027. High-multiple stocks are disproportionately sensitive to growth slowdowns.
- Compare to direct peers. Screen AMD, Broadcom, and Marvell on the same metrics to determine whether Nvidia's premium is sector-wide or company-specific.
For a purpose-built assessment of whether NVDA is currently priced fairly, the NVDA valuation insights tool aggregates these metrics in real time, saving significant manual work.
Key events and dates every Nvidia investor should know
Evaluating Nvidia's price isn't just about the present. Timing matters for every investor.
Price-sensitive events follow a predictable structure for Nvidia, and building a forward calendar is one of the most practical risk management steps an investor can take. Missing a key date means missing the opportunity to either protect existing positions or establish new ones at more favorable prices.
Key dates and events to track:
- May 20, 2026: Next earnings release, the primary catalyst for the next major share price move
- Q4 FY2026 recap: Revenue of $68.1 billion beat expectations; watch for analyst estimate revisions that follow each release
- GTC and industry conferences: Nvidia's annual developer conference often features product announcements with immediate share price impact
- Regulatory updates: Export licensing decisions affecting AI chip sales to restricted markets can create sharp, intraday moves
- Hyperscaler earnings calls (January, April, July, October): Guidance on AI infrastructure spending directly affects Nvidia's forward revenue visibility
Pro Tip: In the two to four weeks ahead of the May 20 earnings date, review your position size and consider whether your current allocation reflects your actual risk tolerance for a potential volatility spike. Earnings beats often produce muted gains when expectations are already elevated, while misses can create outsized drawdowns in high-multiple stocks. Reviewing financial event calendars for comparable high-growth companies helps you calibrate what to expect in terms of price reaction magnitude.
What most investors miss about Nvidia stock
Having covered strategies and event calendars, let's challenge some of the common thinking around Nvidia's stock price.
The most consistent mistake we observe is that investors anchor to recent momentum and treat it as forward guidance. When a stock rises 200% in 18 months, the psychological bias is to extrapolate that trajectory indefinitely. But Nvidia's price already incorporates a great deal of optimism about AI infrastructure spending, and that creates asymmetric risk: the upside from here requires continued execution above already-high expectations, while the downside from a single disappointing quarter can be severe.
There is also a tendency to conflate business quality with valuation safety. Nvidia is undeniably a world-class business. Its technology lead, software moat, and gross margins are exceptional. But high-quality businesses can still be poor short to medium-term investments if purchased at prices that leave no margin for error. The deep dive into valuation data consistently shows that even strong companies experience extended periods of price stagnation or decline when multiples need to normalize.
The market's memory is short, but sustained discipline wins in the long run.
Disciplined investors focus on the combination of earnings trajectory, competitive positioning, and valuation relative to realistic forward scenarios. They treat the May 20 earnings date as an opportunity to reassess rather than a trigger to react impulsively. They size positions based on risk-adjusted return expectations rather than narrative excitement.
Analyze and track Nvidia with advanced tools
To streamline your ongoing tracking and research on Nvidia, take advantage of purpose-built tools designed for serious investors and analysts.
Tickerplace gives you direct access to real-time price data, fundamental metrics, and technical analysis for NVDA and thousands of global equities. Whether you're building a position or stress-testing an existing one, the advanced research platform puts the data you need in one place, without switching between disparate sources.

Use the stock screener to compare Nvidia against sector peers on the exact metrics covered in this article, including P/E, price-to-sales, and revenue growth. For a direct read on whether NVDA's current market price reflects fair value or excess optimism, the NVDA valuation tool synthesizes current data into a clear, actionable output. Smarter decisions start with better data.
Frequently asked questions
When is Nvidia's next earnings report?
Nvidia's next earnings report is scheduled for May 20, 2026, making it the most important near-term event for investors monitoring NVDA's price direction.
What was Nvidia's revenue growth in FY2026?
Nvidia's FY2026 total revenue reached $215.9 billion, a 65% increase year-over-year, driven primarily by exponential growth in AI-related data center spending.
Which sector contributed most to Nvidia's recent growth?
Nvidia's data center segment drove Q4 revenue to $62.3 billion, up 75% year-over-year, making it by far the dominant contributor to total revenue and the primary valuation driver.
How can I analyze if Nvidia is overvalued?
Compare Nvidia's price-to-earnings ratio, PEG ratio, and revenue growth rate to direct semiconductor peers, then stress-test the share price against a scenario where growth decelerates to determine whether the current premium is justified.