
TL;DR:
- Tesla's stock volatility is high, driven by earnings surprises and macroeconomic factors.
- Analyzing long-term trends, volume, and fundamentals provides better investment insights than daily price movements.
- Systematic tools and predefined rules help manage Tesla's rapid and unpredictable price swings.
Watching Tesla's stock ticker can feel like staring at a storm system rather than a financial instrument. TSLA swings 5%, 8%, even 10% in a single session on news that legacy automakers would barely register, leaving retail investors unsure whether to act or stay patient. The problem isn't volatility itself. It's that most investors react to price alone, without the broader context of what's moving it, why it matters, and how to position around it. This guide works through TSLA's recent performance, the forces that drive it, and the practical methods you can use to build a more informed and disciplined investment view.
Key Takeaways
| Point | Details |
|---|---|
| Latest price context | Tesla closed at $376.02 on April 28, 2026, but smart investors look beyond daily moves. |
| Drivers of price | Earnings, market sentiment, and sector trends all shape Tesla's rapid price shifts. |
| Comparison insight | Tesla’s volatility stands out compared to other major stocks, demanding a unique approach. |
| Practical strategies | Using analysis tools and data gives investors the edge over simply reacting to news. |
| Holistic investing | Successful decisions rely on fundamentals and discipline, not just price tracking. |
Recent Tesla stock price performance
With the confusion around price swings introduced, let's start by looking at what the most recent TSLA data tells us.
Tesla closed at $376.02 on April 28, 2026, according to delayed market data published on CNN's TSLA stock quote page. That single number, while useful as a reference point, tells only a partial story. Closing prices represent the last transaction of the regular trading session, and delayed data means you may be looking at a figure that is already 15 to 20 minutes old by the time it appears on most retail platforms.
| Metric | Value |
|---|---|
| Latest closing price | $376.02 |
| Data date | April 28, 2026 |
| Data type | Delayed quote |
| Exchange | NASDAQ |
| Ticker symbol | TSLA |
"A closing price without context is just a number. What matters is whether that number reflects improving fundamentals, deteriorating sentiment, or simple market noise."
Retail investors often mistake a large daily move for a meaningful signal. In reality, TSLA's average daily range has historically exceeded that of most S&P 500 constituents, meaning a 3% or 4% swing can be entirely normal. The more productive question is whether the price aligns with underlying business value. A TSLA valuation analysis that factors in earnings growth, margins, and competitive positioning will give you far more signal than the closing print alone.
To gain real context, you should chart price across multiple timeframes: 30 days, 90 days, one year, and five years. Patterns that look alarming on a daily chart often appear as minor fluctuations on a longer view. Using a reliable stock price calculator helps you model what those historical prices would mean for entry points you may have considered at various times.

What drives Tesla's stock price?
Now that you've seen the latest price, it's time to dig into what actually causes TSLA to rise or fall.
Tesla's price behavior is shaped by a combination of company-specific factors and broader macro forces. Understanding both layers is essential before acting on any price movement.
Key drivers of TSLA price include:
- Earnings and revenue surprises: When Tesla reports quarterly results, the stock frequently makes its largest single-day moves. A miss on delivery numbers or profit margins can trigger sharp sell-offs, while a beat often sparks rapid rallies.
- Growth expectations and guidance: TSLA carries a premium valuation that depends heavily on projected future growth. Shifts in investor expectations, even slight ones, can compress or expand the multiple investors are willing to pay.
- Macro environment: Interest rates, inflation data, and broader equity market sentiment all influence TSLA, which as a high-multiple growth stock tends to be more sensitive to rate changes than lower-growth peers.
- News and executive statements: Announcements from Elon Musk, regulatory decisions, product launches, and even social media activity can trigger outsized moves in TSLA relative to what the same news would do to a more stable stock.
- Institutional and retail flows: Heavy retail participation in TSLA means sentiment swings can be amplified, with momentum traders and options activity adding fuel to both upside and downside moves.
One of the most common mistakes investors make is ignoring volume beneath the price. The TSLA stock quote data provides daily volume figures, and interpreting them matters. A price increase on declining volume is far less convincing than the same move on two or three times average volume. Understanding trading volume insights lets you assess whether institutional conviction exists behind a move or whether it's mostly noise.
Pro Tip: Before acting on a Tesla price move, check the day's trading volume relative to its 30-day average. A move without volume is a rumor; a move with volume is a signal worth investigating further.
It is equally important to recognize the role of the TSLA overvalued or undervalued guide as a counterweight to headline reactions. When sentiment turns negative quickly, a fundamentals-grounded framework helps you avoid selling at precisely the wrong time.
Tesla price trends vs. other major stocks
To really understand what makes TSLA unique, let's see how its price trends match up to some other big names.
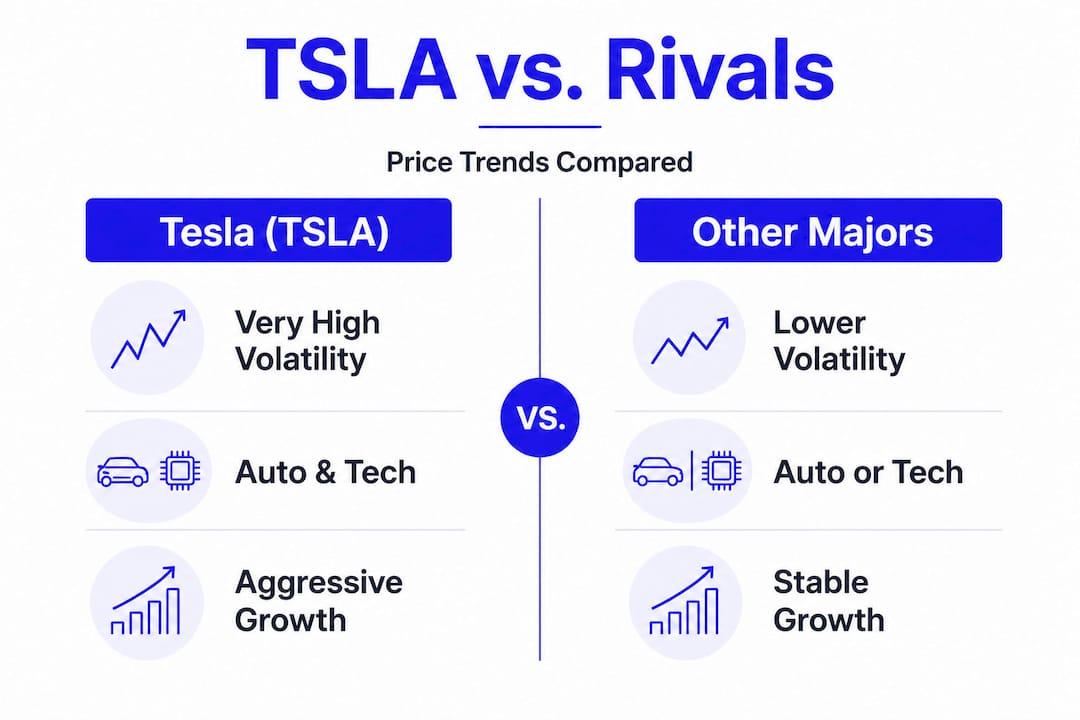
Tesla regularly draws comparisons to legacy automakers like Ford and General Motors, and also to high-growth technology companies. Neither comparison fully captures it, which is part of why its valuation is so debated. The table below illustrates how TSLA's recent behavior differs from a selection of comparable names.
| Stock | Approximate 52-week volatility | Primary sector | Growth profile |
|---|---|---|---|
| TSLA (Tesla) | Very high | Auto/Technology | High growth, premium multiple |
| F (Ford) | Moderate | Automotive | Low growth, value multiple |
| GM (General Motors) | Moderate | Automotive | Low growth, value multiple |
| NVDA (Nvidia) | High | Technology | High growth, premium multiple |
| S&P 500 Index | Low to moderate | Diversified | Moderate |
TSLA behaves more like a high-growth technology company than a traditional automaker in terms of volatility. This is partly a function of its market capitalization, its retail investor base, and the scale of expectations baked into its price. Staying current on market movements insights helps you understand whether TSLA's moves are company-specific or part of a broader sector rotation.
When comparing stock performance across names, here's what to focus on:
- Beta: A measure of how much a stock moves relative to the broader market. TSLA's beta has historically been above 1.5, meaning it amplifies market moves in both directions.
- Relative strength: Is TSLA outperforming or underperforming the S&P 500 over 30, 60, and 90 days? Divergence from the index can signal something stock-specific.
- Volume trends: Are trending high-volume stocks seeing flows into or out of TSLA compared to peers?
- Earnings growth rate: How does TSLA's projected earnings per share growth compare to its valuation premium versus competitors?
Understanding these differences shapes strategy. A long-term investor may be comfortable with TSLA's volatility because they believe in its multi-year trajectory. A shorter-term trader, however, needs to account for that same volatility as a risk management variable, not just an opportunity.
How to analyze and use Tesla stock price data
With context and comparisons in hand, here's how you can put TSLA price data to work for your investing strategy.
A structured, step-by-step approach to analyzing TSLA will serve you far better than scanning headlines or chasing intraday moves.
- Retrieve the current and historical price. Start with a reliable source. The current TSLA close of $376.02 is your baseline. Pull data across at least one and five years to understand the price range in a broader context.
- Chart key timeframes. Plot the 50-day and 200-day moving averages alongside price. When short-term averages cross below long-term ones, it signals potential weakness. The reverse is a potential strength signal.
- Calculate your personal return scenarios. Use a stock average price tool to model what your average cost would be given various buying decisions, and how different price targets translate to your actual returns.
- Apply fundamental filters. Reference a TSLA value assessment to check how current price compares to earnings projections, revenue multiples, and historical price-to-earnings ratios.
- Set rules-based triggers. Rather than reacting emotionally, define in advance the price levels or fundamental events that would cause you to add to, reduce, or exit your position.
Common pitfalls to avoid: overfitting past chart patterns to future predictions, and ignoring new information simply because it challenges a prior thesis. The market rewards flexibility, not stubbornness.
Pro Tip: Test at least two or three different entry scenarios using a return calculator before committing capital. Knowing the math behind your expectations reduces the likelihood of panic selling when the stock moves against you.
Our take: Why price alone doesn't tell the TSLA story
Here is an uncomfortable truth that most financial commentary avoids: for a stock as widely covered as Tesla, the price at any given moment reflects the consensus of millions of opinions, many of them based on incomplete information. The investor who acts only on that price is, in effect, outsourcing their judgment to the crowd.
Long-term investors who have done well with TSLA consistently cite innovation progress, energy storage expansion, and software revenue as their real reasons for holding, not the fact that the stock happened to be up last week. The deeper value analysis tools that examine price-to-sales ratios, free cash flow growth, and competitive moats are what separate informed conviction from emotional trading.
The TSLA closing price of $376.02 on April 28, 2026 matters as a data point. It does not matter as a decision-making framework on its own. Traders who use systematic tools and predefined risk parameters are consistently better positioned than those who chase headlines. This is especially true for Tesla, where sentiment can shift dramatically within a single trading day based on a single tweet or earnings call soundbite.
Analyze Tesla and more with advanced tools
Understanding TSLA's price trends is just the starting point for building a well-researched investment thesis.

Tickerplace provides the analytical depth you need to go further. From the stock screener tool that lets you filter and compare equities by valuation, volume, momentum, and sector, to a full library of investing education resources that ground your strategy in proven principles, the platform is built for investors who want more than a ticker quote. Whether you're monitoring TSLA closely or building a diversified portfolio, explore Tickerplace to access real-time data, technical and fundamental analysis, and research tools designed to support smarter, more confident decisions at every stage of your investing journey.
Frequently asked questions
What was Tesla's latest closing stock price?
Tesla closed at $376.02 on April 28, 2026, according to delayed market data. This figure represents the last transaction price of the regular NASDAQ trading session on that date.
Why does Tesla's stock price change so much?
TSLA's price moves are driven by a combination of earnings reports, growth expectations, macro events, and heavy retail participation. Its high-beta profile means it amplifies broader market moves more than most stocks.
Where can I find reliable Tesla price history?
Major financial platforms and dedicated research tools provide up-to-date Tesla price history, including delayed and real-time quotes. CNN's TSLA stock quote page is one reliable public source for reference data.
How can I analyze Tesla's price beyond headlines?
Combine historical charting, fundamental valuation metrics, and return modeling tools to build a data-driven view. Comparing TSLA to peers on volatility, earnings growth, and relative strength provides the context that headlines alone cannot.