TL;DR:
Retail investors mainly rely on price charts and quick news scans, risking poor decision quality.
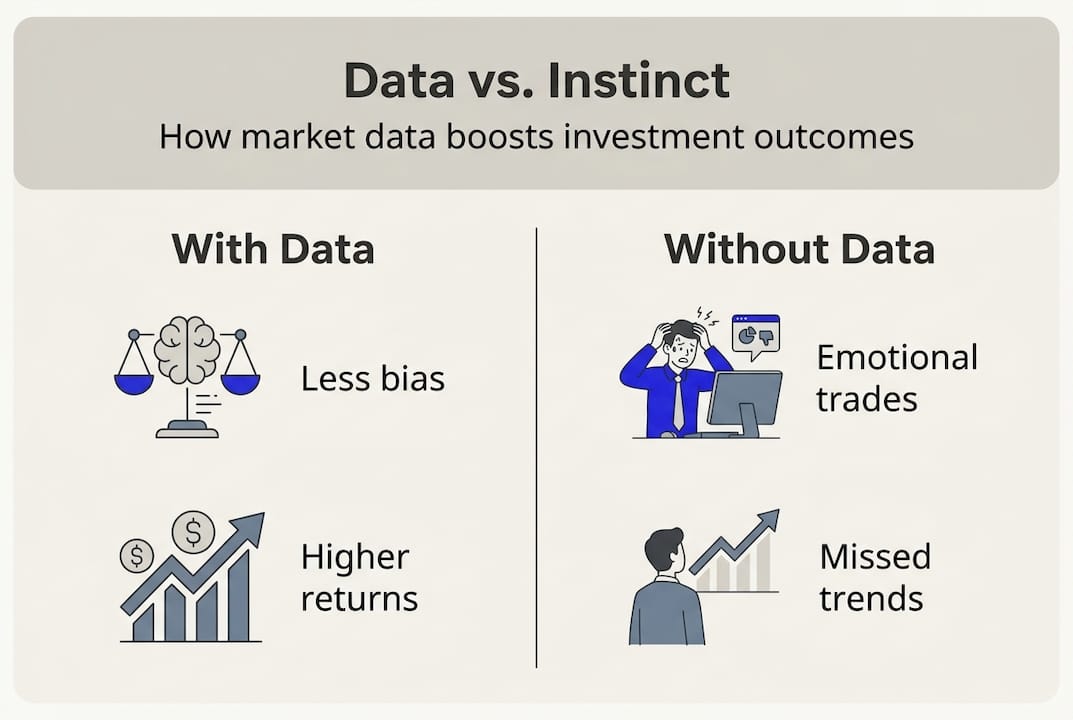
Systematic, data-driven strategies outperform gut-based decisions by reducing emotional bias and enhancing consistency.
Overuse of market data can lead to overtrading and model overfitting, requiring disciplined process and focus.
Most investors trust their instincts more than they trust their data. Research shows that retail investors spend a median 6 minutes per trade on research before placing an order, relying primarily on price charts and quick news scans. That’s a remarkably thin foundation for decisions that can meaningfully affect your financial future. This guide breaks down what market data actually is, how serious investors and advisors use it, and why a systematic, data-driven approach consistently outperforms gut-based decision-making.
Key Takeaways
| Point | Details |
|---|---|
| Data beats opinion | Using market data removes emotional bias and leads to more reliable investing decisions. |
| Systematic strategies win | Rules-based methods powered by market data show superior returns versus intuition and trends. |
| Balance is key | The best investors use market data intentionally but never rely on it blindly or chase every signal. |
| Start simple | Focus on price, volume, and basic indicators before layering in complex analysis. |
What is market data and why does it matter?
Market data is the raw, quantifiable information generated by financial markets: prices, trading volume, order flow, technical indicators, and sentiment signals. It is the foundation upon which every credible investment thesis is built. Without it, you’re navigating by feel in a market shaped by millions of participants acting on facts.
There are several distinct categories of market data every investor should recognize:
-
Price data: Open, high, low, and close values for any given period
-
Volume data: The number of shares or contracts traded, signaling conviction behind a move
-
Fundamental data: Earnings, revenue, debt-to-equity ratios, and payout ratios
-
Technical indicators: Moving averages, RSI, MACD, and Bollinger Bands
-
News sentiment: Aggregated signals from headlines, analyst reports, and social media
Why does this matter? Because emotional noise is the enemy of good investing. Fear, greed, and recency bias distort judgment in ways that data simply does not. Learning to read market data correctly gives you a structured lens to evaluate opportunities without being swayed by the headline of the day.
“Systematic rules-based selection using market data consistently outperforms gut-driven investment decisions by removing emotional interference from the process.”
When you anchor your decisions in objective signals rather than opinions, you shift from reactive trading to deliberate strategy. That shift is where real edge begins. Start by reading market data with a clear framework before you act.
How do investors and advisors use market data in practice?
Understanding what market data is paves the way for real-world application. Here’s how investors and advisors actually put it to work.
A typical individual investor workflow looks something like this: spot a potential opportunity through a screener or news alert, pull up the price chart to assess trend and momentum, scan recent earnings or analyst revisions, then decide on a position. The entire process often takes just minutes, which is why discipline and a structured checklist matter so much.
Financial advisors operate with a broader mandate. They use real-time data to build diversified, rules-based portfolios, rebalance allocations based on shifting fundamentals, and monitor risk exposure across client accounts. Their edge comes not from speed but from consistency: applying the same data-driven criteria across every decision.
Key ways both groups apply market data include:
-
Screening stocks by valuation metrics such as P/E ratio and price-to-book
-
Identifying momentum by comparing relative strength across sectors
-
Timing entries and exits using technical signals confirmed by volume
-
Monitoring macro indicators like yield curves and sector rotation trends
The uncomfortable truth is that retail investors spend most time on price charts alone, often skipping the fundamental layer entirely. That creates blind spots.

Pro Tip: Use multi-factor screeners that combine technical and fundamental filters simultaneously. This prevents you from chasing hype stocks that look strong on charts but carry unsustainable valuations. Explore strategies for analyzing stocks and consider optimizing your trading workflow to build a repeatable process.
The case for market data: outperformance through systematic strategies
Once you know how market data fits into research, let’s see how systematic, data-driven strategies dramatically outperform guessing or news chasing.
The empirical evidence is compelling. Momentum strategies outperform benchmarks by a wide margin: in documented comparisons, CSCO momentum strategies returned 32.46% versus the DJIA’s 12.32%, while hybrid machine learning and Markowitz portfolio models exceeded the NDX100. These aren’t theoretical projections; they are backtested results from rules-based systems applied consistently.
| Strategy type | Example return | Benchmark | Outperformance |
|---|---|---|---|
| Momentum strategy | 32.46% | DJIA 12.32% | +20.14% |
| ML-Markowitz hybrid | Exceeds NDX100 | NDX100 baseline | Positive alpha |
| Buy-and-hold (gut) | Variable | S&P 500 | Often negative |
Why do rules-based systems work? They filter out emotional noise. A systematic approach doesn’t panic when a stock drops 8% in a session; it evaluates whether the underlying data signals a structural change or a short-term fluctuation. That discipline is extremely difficult to replicate manually.
Here is a practical four-step process for systematic stock selection:
-
Gather data: Pull price history, volume trends, and fundamental metrics from a reliable source
-
Apply screeners: Filter by your chosen criteria, such as earnings growth above 15% and RSI between 40 and 60
-
Confirm technicals: Verify that chart structure aligns with the fundamental thesis before committing capital
-
Review and repeat: Reassess positions on a scheduled basis rather than reacting to daily noise
Review stock filters that outperform to see which screening criteria have historically delivered the strongest risk-adjusted returns.
Limits, risks, and the nuanced role of market data
But relying on market data isn’t foolproof. There are pitfalls and important nuances every investor must understand.
Market data can amplify volatility when overconfidence leads retail investors to overtrade or misread signals. Strategies that worked in one market regime can fail in another, and models built on historical data are always at risk of overfitting: performing brilliantly on past data while failing in live conditions.
| Advantage | Risk |
|---|---|
| Removes emotional bias | Overfitting to historical patterns |
| Enables rules-based consistency | High trading costs from overactivity |
| Identifies trends early | Signal decay as strategies become widely known |
| Supports diversification | Data misinterpretation under stress |
The statistics are sobering: more than 98% of active retail strategies fail to beat benchmarks over the long term. Algorithmic approaches can reduce spreads and improve liquidity, but they also raise the bar for individual investors trying to compete.
Common pitfalls to watch for:
-
Confirmation bias: Seeking data that supports a pre-existing view rather than challenging it
-
Trend chasing: Entering positions after most of the move has already occurred
-
Overtrading: Reacting to every data point instead of waiting for high-conviction setups
-
Ignoring context: Treating a technical signal in isolation without considering macro conditions
Pro Tip: Build a process you can follow consistently, then measure its results over at least 20 to 30 trades before making changes. Consistency in process reveals whether a strategy has genuine edge. Stay focused by monitoring leading stocks as reference points rather than chasing every move.
A practical perspective: when market data matters (and when it doesn’t)
After exploring advantages and risks, let’s get honest about how market data should, and shouldn’t, shape your investing.
The investors who use data most effectively are not the ones with the most screens or the most complex models. They are the ones who have identified a small set of signals that align with their strategy and follow them with discipline. Data overload is a real problem. When you track 40 indicators simultaneously, they inevitably contradict each other, leaving you paralyzed or, worse, selectively reading what confirms your bias.
True edge comes from using data as a tool, not a crutch. A sound investing plan defines your criteria before you look at any chart. Data then confirms or disqualifies, not dictates. The best investors don’t worship data; they use it to reinforce resilient habits. Making smarter data decisions starts with knowing which signals matter for your specific strategy and ignoring the rest.
Ready to put market data to work?
If you’ve built a clearer picture of how market data drives better investing outcomes, the next step is applying that knowledge with the right tools.

Tickerplace gives you access to an advanced stock screener that combines technical and fundamental filters so you can build rules-based strategies without the guesswork. Use the stock return calculator to model historical performance before committing capital. And explore the full suite of market research tools to monitor trends, compare equities, and identify opportunities with confidence. Systematic investing starts with the right data infrastructure.
Frequently asked questions
What is market data and where does it come from?
Market data encompasses prices, volume, and news sentiment for stocks or other assets, supplied in real time or historically by exchanges, brokers, and financial news providers.
How does market data help improve my trading decisions?
It helps you spot trends, avoid emotional trades, and build strategies that have historically outperformed benchmarks; systematic rules powered by data have consistently reduced behavioral bias and improved returns.
Are there any risks with relying on market data?
Yes: overusing data can cause overtrading, increase costs, and push you toward chasing short-term trends; risks include overfitting models and increased volatility, while retail strategies often underperform benchmarks over the long term.
What types of market data are most important for beginners?
Start with price charts, volume data, and simple technical indicators to identify entry and exit points; investors spend most research time on price charts, making them the logical starting point before exploring more advanced tools.