Many investors believe a high dividend yield automatically signals a great stock. In reality, dividend yield is just one piece of the puzzle, and chasing the highest yields can lead to costly mistakes. This guide walks you through the precise calculation of dividend yield, how it changes with market conditions, what benchmarks matter across different sectors, and how to use this metric wisely alongside sustainability indicators. You’ll learn to spot yield traps, interpret sector variations, and integrate dividend yield into a total return strategy that balances income with growth potential.
Key Takeaways
| Point | Details |
|---|---|
| Definition and formula | Dividend yield is the percentage of an investment returned as cash dividends relative to the stock price, computed as annual dividends per share divided by the current price and multiplied by 100. |
| Calculation methods | Trailing yield uses actual payments from the last 12 months, forward yield relies on next year’s projections, and indicated yield multiplies the most recent quarterly dividend by four. |
| Price relation and traps | Dividend yield moves inversely to price, so a price drop with a constant dividend raises yield and can mislead investors into chasing income traps. |
| Sustainability and use | Evaluating dividend sustainability helps distinguish high yields from risky cuts and supports combining yield with growth potential in a total return strategy. |
What is dividend yield? Understanding the basics
Dividend yield is a financial ratio that shows how much cash a company returns to shareholders relative to its stock price. The standard formula is straightforward: divide annual dividends per share by the current share price, then multiply by 100 to get a percentage. If a stock trades at $50 and pays $2 in annual dividends, the dividend yield is 4%.
Calculating annual dividends can take several forms. The trailing 12 months method sums the last four quarterly dividends actually paid. The last four quarters approach uses the most recent dividend and multiplies by four, assuming consistency. Forward estimates rely on analyst projections or company guidance for the next 12 months. Each method has trade-offs: trailing data is concrete but backward looking, while forward estimates incorporate expected changes but introduce uncertainty.
The current share price is the denominator in the formula, and it fluctuates continuously during market hours. Most financial platforms use the closing price from the previous trading day for consistency. The resulting percentage tells you what portion of your investment you’d receive as cash dividends over a year, assuming dividends and price remain constant.
Key calculation variants and data sources include:
-
Trailing yield based on actual payments from the last 12 months
-
Forward yield using next year’s estimated dividends
-
Indicated yield multiplying the most recent quarterly dividend by four
-
SEC filings and company investor relations pages for official dividend declarations
-
Financial data providers like Bloomberg, FactSet, and Tickerplace for aggregated metrics
Understanding which calculation method a source uses is critical. A stock with a recent dividend cut might show a high trailing yield that doesn’t reflect current reality. Conversely, a company announcing a dividend increase will have a higher forward yield than trailing yield. Always verify the time period and methodology behind any dividend yield figure you encounter.
How dividend yield behaves: price impact, types and traps
Dividend yield moves inversely to stock price because the numerator stays fixed while the denominator changes. When a stock drops from $100 to $80 but maintains a $4 annual dividend, the yield jumps from 4% to 5%. This creates an optical illusion where falling stocks appear more attractive to income seekers, even though the underlying business may be deteriorating.
Trailing yield reflects historic dividend payments, making it reliable for past performance but potentially misleading if dividends were recently cut or suspended. Forward yield incorporates expected future payments, offering a more accurate picture when companies announce dividend changes. Analysts adjust forward estimates based on earnings projections, payout policy statements, and cash flow trends.
Yield traps represent one of the biggest dangers in dividend investing. A yield above 8% often signals financial distress rather than generosity. Companies facing declining revenues, mounting debt, or shrinking margins may see their stock prices collapse while dividends haven’t been cut yet. Investors attracted by the high yield end up suffering both dividend cuts and further price declines.
Special dividends and one-time payments distort trailing yields significantly. When a company sells a division or returns excess cash through a special dividend, the trailing 12-month yield spikes temporarily. This inflated figure doesn’t represent the ongoing dividend policy. Always separate regular recurring dividends from special payments when evaluating yield sustainability.
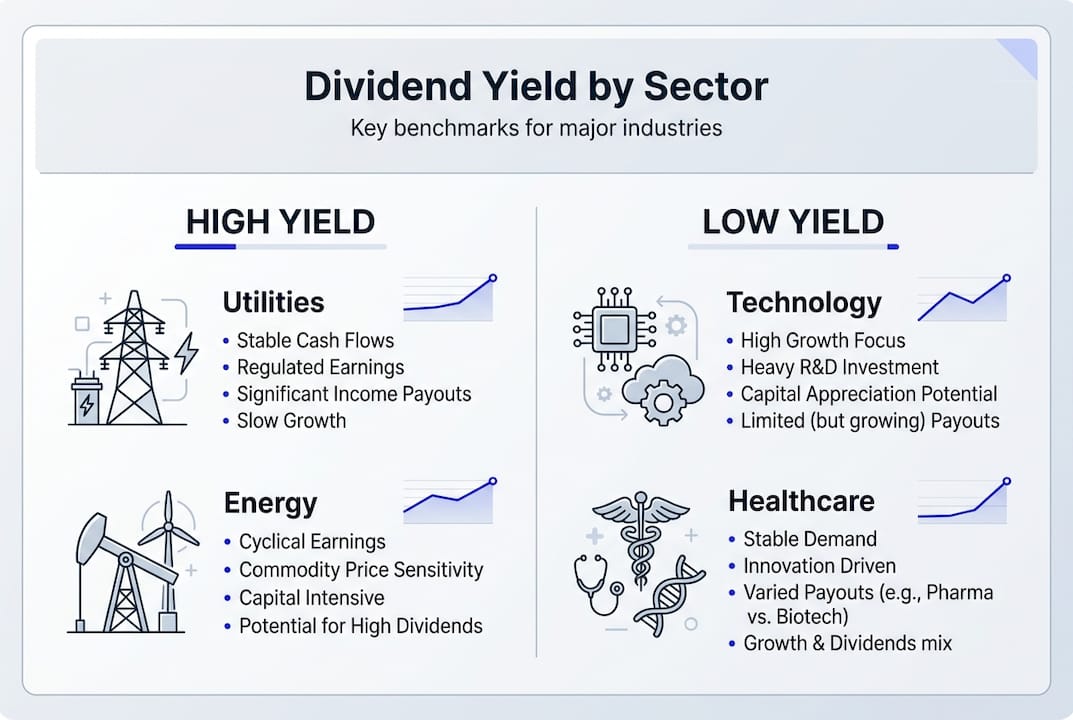
Sector characteristics create wide yield variations. Utilities and real estate investment trusts typically offer 3-5% yields because their stable cash flows and regulatory frameworks support consistent payouts. Technology companies often yield under 1% as they prioritize reinvestment in growth over cash returns. Energy companies fluctuate with commodity prices, sometimes offering high yields during boom periods that prove unsustainable during downturns.
Common yield behavior scenarios:
-
Price decline with stable dividends raises yield artificially
-
Dividend cut causes immediate yield drop and often further price weakness
-
Dividend growth combined with price appreciation keeps yield stable
-
Special dividends temporarily inflate trailing yield calculations
-
Sector rotation shifts investor preference between high yield and growth stocks
Pro Tip: Cross reference dividend yield with the company’s five year dividend history. Consistent growth in absolute dividend payments matters more than a temporarily elevated yield percentage. A company raising dividends 10% annually while maintaining a 3% yield builds wealth more reliably than a 7% yielder with stagnant or declining payments.
Dividend yield benchmarks and sector variations
The S&P 500 dividend yield has declined over decades as growth oriented technology companies gained index weight. Historical averages ranged from 1.8% to 2.9%, but the current yield sits around 1.2-1.3% as of 2026. This shift reflects changing market composition rather than reduced corporate generosity in absolute terms. Total dividend payments continue growing even as yields compress.
Dividend paying stocks within the S&P 500 show higher yields than the index average because many large technology companies pay no dividends at all. When you filter for only companies with active dividend programs, the average yield rises closer to 2%. This distinction matters for income focused portfolios that exclude non payers entirely.
Sector specific yield patterns emerge from business model differences and capital allocation preferences. Energy companies averaged 3.47% at the end of 2025, reflecting mature operations with limited growth opportunities and shareholder pressure for cash returns. Real estate investment trusts yielded 3.50%, driven by legal requirements to distribute 90% of taxable income. Utilities delivered 2.84% yields, supported by regulated cash flows and stable demand.
Consumer staples companies offered 2.59% yields, balancing modest growth with reliable dividends from non cyclical products. Financials and industrials cluster in the 2-3% range, varying with economic cycles and capital intensity. Healthcare yields around 1.5-2%, split between mature pharmaceutical companies paying higher dividends and biotech firms reinvesting heavily in research.
Technology sector yields remain the lowest at just 0.51%, as most companies prioritize growth investments and share buybacks over dividends. The few tech dividend payers like Apple and Microsoft yield 0.5-1%, far below traditional income sectors but representing enormous absolute dollar amounts given their massive market capitalizations.
| Sector | Average dividend yield (2025-2026) | Typical characteristics |
|---|---|---|
| Energy | 3.47% | Commodity exposure, mature operations |
| Real Estate | 3.50% | REIT distribution requirements |
| Utilities | 2.84% | Regulated cash flows, stable demand |
| Consumer Staples | 2.59% | Non cyclical, consistent payouts |
| Financials | 2.0-2.5% | Cycle sensitive, capital requirements |
| Healthcare | 1.5-2.0% | Mixed pharma dividends and biotech growth |
| Industrials | 1.8-2.2% | Capital intensive, economic sensitivity |
| Technology | 0.51% | Growth focus, buyback preference |
These sector variations reflect fundamental differences in capital needs, growth opportunities, and investor expectations. A 2% yield in technology might signal strong commitment to shareholders, while the same yield in utilities would indicate potential financial stress. Always evaluate dividend yield within sector context rather than applying universal benchmarks.
How to use dividend yield for investment decisions
Dividend yield alone tells you nothing about whether a stock is a good investment. A 6% yield on a company bleeding cash is far worse than a 2% yield on a business growing earnings 15% annually. Smart investors use dividend yield as one input within a comprehensive analysis framework.
Payout ratio measures what percentage of earnings a company distributes as dividends. Calculate it by dividing annual dividends per share by earnings per share. A payout ratio above 80% leaves little room for dividend growth or economic downturns. Ratios between 40-60% typically indicate sustainable dividends with growth potential. Some sectors like REITs naturally run higher payout ratios due to distribution requirements.
Free cash flow sustainability matters more than accounting earnings for dividend safety. Companies can manipulate earnings through non cash charges, but cash flow is harder to fake. Divide annual dividends by free cash flow to see if the company generates enough cash to cover payments. A ratio above 100% means the company is borrowing or selling assets to fund dividends, an unsustainable situation.
Dividend history provides crucial risk assessment data. Companies with 20+ years of consecutive dividend increases, known as Dividend Aristocrats, demonstrate management commitment and business resilience. A single year of dividend cuts often precedes years of stagnant or declining payments. Check whether dividends were maintained during the 2008 financial crisis and 2020 pandemic as stress tests of dividend reliability.
Total return investing combines dividend income with price appreciation for a complete performance picture. A stock yielding 2% that appreciates 12% annually delivers 14% total return, outperforming a 5% yielder with flat price performance. Many high yield stocks underperform over long periods because their business models are mature or declining.
Total shareholder yield adds share buybacks to dividends for a fuller picture of cash returned to shareholders. A company yielding 2% in dividends while buying back 3% of shares annually delivers 5% total shareholder yield. Research shows total shareholder yield predicts future returns better than dividend yield alone.
Practical steps to evaluate dividend stocks:
-
Screen for yields between 2-5% to avoid both low income and yield traps
-
Verify payout ratio under 70% for non REIT companies
-
Check five year dividend growth rate exceeds inflation
-
Confirm free cash flow covers dividends with 20%+ cushion
-
Review dividend history for consistency through economic cycles
-
Compare yield to sector average to identify outliers
-
Analyze total return potential combining dividends and growth prospects
Pro Tip: Calculate your personal yield on cost by dividing current annual dividends by your original purchase price. A stock bought at $50 now trading at $75 with $3 annual dividends yields 4% currently but 6% on your cost basis. This metric shows how dividend growth builds income over time for long term holders.
Balance income needs with growth potential based on your investment timeline. Retirees requiring current income might accept lower growth rates for 4-5% yields. Younger investors can prioritize 2% yielders with strong dividend growth, allowing compounding to build future income streams. The right approach depends on your financial situation rather than universal rules.
| Strategy | High yield approach | Total return approach |
|---|---|---|
| Target yield | 5-8% | 2-4% |
| Primary goal | Maximize current income | Balance income and growth |
| Typical holdings | Utilities, REITs, MLPs | Diversified across sectors |
| Risk profile | Yield trap danger, limited appreciation | Lower current income, better long term |
| Best for | Near term income needs | Long term wealth building |
| Historical performance | Underperforms in bull markets | Outperforms over full cycles |
Explore tools and resources at Tickerplace
Putting dividend yield analysis into practice requires access to comprehensive financial data and screening capabilities. Tickerplace provides the research infrastructure you need to evaluate dividend stocks across global markets. Our platform aggregates real time pricing, dividend histories, payout ratios, and sector comparisons in one interface.

The stock screener tool lets you filter thousands of companies by dividend yield ranges, payout ratios, dividend growth rates, and dozens of other fundamental metrics. Set your criteria for sustainable dividend stocks and generate a custom watchlist in seconds. Compare candidates side by side with detailed financial profiles and technical charts.
Expand your investment knowledge through our educational resources covering dividend strategies, valuation methods, and portfolio construction. Whether you’re building an income portfolio or researching individual positions, Tickerplace streamlines the analysis process so you can make informed decisions faster.
What is dividend yield? Common questions answered
What is the difference between dividend yield and payout ratio?
Dividend yield measures dividends relative to stock price, showing your income return as a percentage. Payout ratio measures dividends relative to earnings, indicating what portion of profits the company distributes. A stock can have a high yield due to a fallen price but a low payout ratio if earnings remain strong, or vice versa.
How do dividends affect stock price and yield over time?
When a company pays a dividend, the stock price typically drops by the dividend amount on the ex dividend date. This mechanical adjustment keeps the total value constant. Over longer periods, consistent dividend growth often correlates with price appreciation as it signals business strength, though the relationship isn’t automatic.
Where can I find reliable dividend yield data?
Company investor relations pages publish official dividend declarations and payment schedules. SEC filings like 8-K forms announce dividend changes immediately. Financial data platforms including Tickerplace, Bloomberg, and Yahoo Finance aggregate dividend data with historical trends. Always verify the calculation method, whether trailing or forward, before comparing yields across sources.
Are dividend yields taxed differently than other investment income?
Qualified dividends receive preferential tax treatment in the United States, taxed at long term capital gains rates of 0%, 15%, or 20% depending on income. Non qualified dividends are taxed as ordinary income at higher rates. To qualify, you must hold the stock for more than 60 days during the 121 day period around the ex dividend date, and the company must be a U.S. corporation or qualified foreign entity.
What are the risks of relying solely on dividend yield?
High yields often accompany deteriorating businesses where price declines outpace dividend cuts, creating value traps. Dividend yield ignores growth potential, capital appreciation, and total return. Companies can maintain dividends temporarily while business fundamentals weaken, leading to eventual cuts. Sector and market conditions affect appropriate yield levels, making cross sector comparisons misleading without context.