
TL;DR:
- Wesfarmers' share price reflects both market sentiment and underlying segment performance, influenced by commodity trends.
- Investors should use dividend-adjusted prices and total return indices to accurately assess long-term performance.
- Short-term price movements often result from sector-specific catalysts, emphasizing the importance of contextual analysis.
The Wesfarmers share price is one of the most closely watched equity metrics on the ASX, and for good reason. As a conglomerate spanning retail, industrials, and healthcare, Wesfarmers' stock performance reflects both consumer sentiment and commodity dynamics in ways that can surprise even experienced investors. In mid-2026, the company's shares have moved through a notable trading range, prompting renewed attention from analysts and portfolio managers alike. This article breaks down the key price data, corporate action adjustments, and analyst insights you need to interpret Wesfarmers shares with accuracy and confidence.
Key takeaways
| Point | Details |
|---|---|
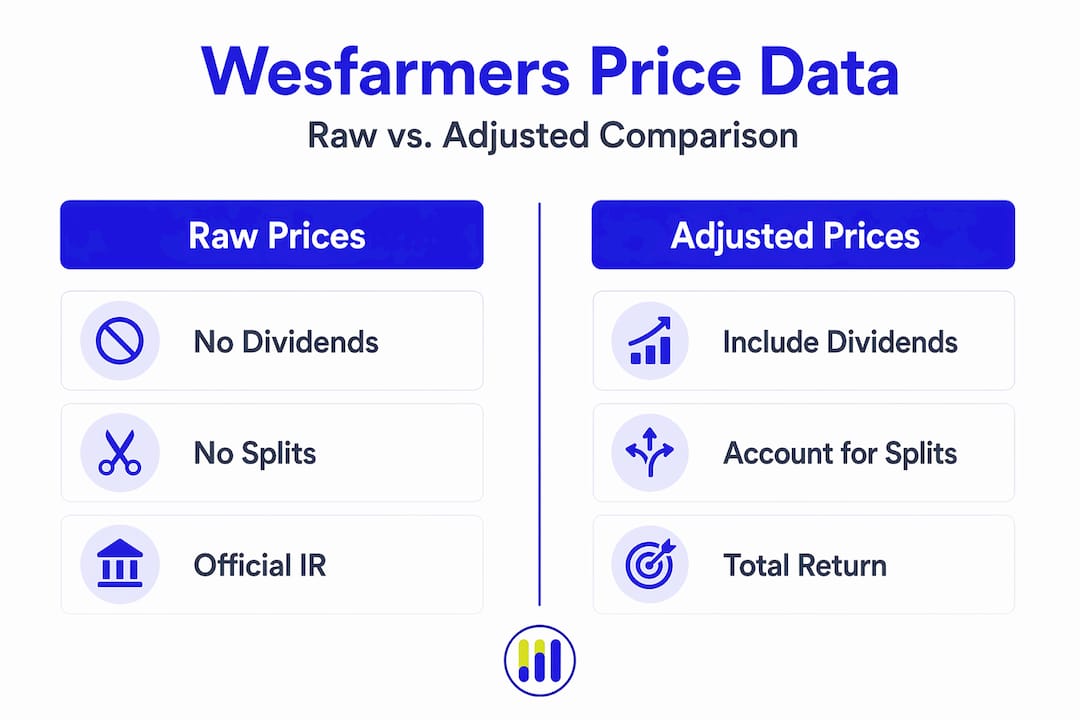
| Raw prices can mislead | Wesfarmers' official IR data is unadjusted for dividends and splits, so always cross-reference adjusted feeds for modeling. |
| 52-week range signals opportunity | The stock traded between A$71.31 and A$91.85 in 2026, with a recent rebound off lows after an analyst upgrade. |
| Beta confirms defensive behavior | A beta of 0.80 means Wesfarmers moves less than the broader market, supporting its blue-chip status. |
| Dividends change the return picture | Total shareholder return includes both price gains and dividends; ignoring either distorts your performance view. |
| Analyst catalysts matter | Revised lithium pricing assumptions and Morgans' upgrade to 'Accumulate' drove a 7.33% single-session price gain. |
Understanding the Wesfarmers share price data
Before drawing conclusions from any price figure you see quoted, you need to understand exactly what that number represents. The Wesfarmers share price you encounter on most platforms is a last traded price, typically delayed by at least 15 minutes during market hours. It reflects the most recent transaction, not necessarily where the stock will open the next session.
The key price data points investors and analysts track daily include:
- Opening price: The first traded price when the ASX opens at 10:00 AM AEST
- Closing price: The volume-weighted average price calculated in the closing auction, which is the official benchmark for institutional settlement
- Day high and low: The intraday range, which indicates market conviction or indecision on that session
- Trading volume: The number of shares exchanged, a signal of liquidity and institutional interest
For historical closing prices, Wesfarmers publishes an investor relations lookup table on its website. Published ASX closing prices for the week of May 18 to 22, 2026, ranged from A$71.26 to A$74.75, with a split adjustment factor of 1:1, confirming no active splits during that period.
However, there is a critical limitation. Wesfarmers' own IR data is unadjusted for dividends and stock splits, which means using it for long-run return modeling produces systematically biased results. Practitioners cross-reference these figures with adjusted price feeds from institutional data providers to correct for this.
Pro Tip: When building a long-term price chart or return model for Wesfarmers, always use dividend-adjusted closing prices from a professional data source. The IR lookup table is useful for confirming specific dates but not for calculating total returns over multi-year horizons.
Recent price movements and trading range in 2026
The 2026 trading picture for Wesfarmers has been defined by two phases: a significant pullback to near multi-year lows, followed by a sharp recovery triggered by analyst action. Understanding both phases tells you a great deal about the Wesfarmers share value at this point in the cycle.
![]()
In May 2026, shares hit 52-week lows near A$70.80, reflecting broader market softness and uncertainty around commodity earnings. The subsequent Morgans upgrade pushed the price to A$76.48 at open, representing a 7.33% single-session gain. That kind of move on a large-cap stock is unusual and signals that the market had priced in considerable pessimism.
Here is a summary of the key price metrics for Wesfarmers in the current period:
| Metric | Value (May 2026) |
|---|---|
| 52-week low | A$71.31 |
| 52-week high | A$91.85 |
| Price at time of upgrade | A$72.25 |
| Post-upgrade open | A$76.48 |
| Beta | 0.80 |
The 52-week range of A$71.31 to A$91.85 represents a spread of nearly 29%, which is wide for a company of Wesfarmers' quality. This suggests that the market is pricing in genuine uncertainty, particularly around commodity-linked segments.
The beta of 0.80 is worth highlighting. A beta below 1.0 means the stock historically moves less than the overall market. For investors seeking defensive equity exposure with dividend income, this characteristic reinforces Wesfarmers' classification as a blue-chip holding. The "blue chip" label, borrowed from the high-value blue chips in poker, reflects both stability and premium quality in a portfolio context.
The stock's 50-day and 200-day moving averages act as dynamic support and resistance levels. When the current price of Wesfarmers shares trades below its 200-day moving average, as it did near the May lows, it typically flags a technically oversold condition that attracts value-focused buyers.
Corporate actions and dividend impact on price data
This is one of the most frequently misunderstood aspects of interpreting historical share price data, and it directly affects how you assess the value of Wesfarmers shares over time.
When a company pays a dividend, the stock price drops by approximately the dividend amount on the ex-dividend date. This is a mechanical price adjustment, not a loss of value. If you compare an unadjusted price chart across an ex-dividend date, it will appear as though the stock declined. In reality, shareholders received that value as a cash payment.
| Price series type | Accounts for dividends | Accounts for splits | Suitable for return modeling |
|---|---|---|---|
| Unadjusted (IR source) | No | No | No |
| Dividend-adjusted (market provider) | Yes | No | Partial |
| Fully adjusted (total return) | Yes | Yes | Yes |
The official Wesfarmers investor relations page explicitly states that prices are not adjusted for stock splits or dividends. This matters because Wesfarmers has a consistent dividend history, meaning any multi-year comparison using raw IR data will understate total returns considerably.
The concept of total shareholder return (TSR) captures both price appreciation and dividends paid. For long-term Wesfarmers shareholders, dividends have historically contributed a significant portion of TSR, making it misleading to assess performance based on the Wesfarmers stock price alone. Analysts who incorporate expected dividends into total return forecasts avoid the systematic underestimation that plagues simpler price-only analyses.
Pro Tip: If you want to compare the price of Wesfarmers shares against an index or peer group over three or more years, always use a total return index as your benchmark and a dividend-adjusted price series for the stock. Mixing adjusted and unadjusted data is one of the most common modeling errors investors make.
Analyst insights and catalysts in 2026
The May 2026 rally in Wesfarmers shares was not random. It was directly catalyzed by a specific broker action and driven by a revised view on one of the company's key business segments.
Morgans upgraded Wesfarmers from 'Trim' to 'Accumulate' and raised its 12-month target price from A$80.50 to A$81.10. At the prevailing price of A$72.25, that target implies roughly 12% total return including dividends. The catalyst behind the upgrade was a revised outlook on lithium pricing.
Wesfarmers holds a significant stake in the Covalent Lithium project. When lithium price assumptions improve, the earnings contribution from that segment rises, which flows into higher EBIT forecasts. Morgans raised EBIT forecasts by 2% for FY27 and FY28 based on this improved outlook.
The key analyst-identified catalysts affecting the Wesfarmers current price and near-term forecast include:
- Lithium price trajectory: Directly impacts Covalent EBIT and overall group earnings
- Bunnings retail performance: The largest segment by revenue, sensitive to housing activity and consumer spending
- Kmart and Target retail margins: Under pressure in a cost-conscious consumer environment
- Healthcare and industrial segments: Provide diversification that offsets retail and commodity volatility
"Price rebounds can be driven by specific segment catalysts like lithium pricing despite ongoing uncertainty in broader retail markets." (The Bull)
The diversified portfolio across retail, industrials, and healthcare segments means that no single segment failure typically unwinds the entire investment thesis. This structural quality is part of what justifies a premium valuation relative to pure-play retailers or pure commodity companies.
My perspective on reading Wesfarmers beyond the headline
What I've found after tracking large-cap Australian equities over many years is that investors who focus exclusively on the headline Wesfarmers share price tend to draw the wrong conclusions at exactly the wrong time. The May 2026 lows looked alarming on a raw price chart. In context, with dividends factored in and the lithium re-rating visible to those watching segment-level data, the picture was far more nuanced.
In my experience, the single biggest analytical error is treating an unadjusted closing price as a performance measure. It is not. It is a transaction record. Performance is what you get when you combine price returns with dividends and adjust for all corporate actions.
My take on the current setup: the 52-week low near A$70.80 represents a meaningful compression in Wesfarmers share value relative to the company's underlying quality. The segment diversification, defensive beta, and consistent dividend profile have not deteriorated. What changed was market sentiment around one segment. That is a distinction worth making before you react to a short-term price move. You can access Wesfarmers financial statements on Tickerplace to run this kind of segment-level evaluation yourself.
— Tickerplace
Track Wesfarmers shares with Tickerplace
Monitoring a stock like Wesfarmers requires more than checking a price ticker once a day. You need adjusted historical data, real-time quotes, and tools to screen comparable companies across financial metrics.

Tickerplace provides institutional-quality market data and stock screening tools designed for serious investors and analysts. You can filter Wesfarmers against ASX peers by market capitalization, dividend yield, debt-to-equity ratio, and earnings growth, all on a single platform. Real-time price tracking, technical charting, and fundamental data sit alongside educational resources to support every stage of your research. Start your analysis at Tickerplace and move beyond the headline price to the full financial picture.
FAQ
What is the current Wesfarmers share price?
The Wesfarmers current price changes daily during ASX trading hours. As of May 2026, shares traded near A$72 to A$76, with a 52-week range of A$71.31 to A$91.85. Use a real-time data platform for the latest figure.
Why does the Wesfarmers IR site show unadjusted prices?
Wesfarmers' investor relations historical price lookup reports raw closing prices that are not adjusted for dividends or stock splits. Analysts modeling total returns use adjusted price series from third-party data providers to correct for this limitation.
What drove the recent Wesfarmers share price rebound?
The 7.33% single-session gain in May 2026 followed a Morgans upgrade from 'Trim' to 'Accumulate' and a raised target price of A$81.10, driven by improved lithium pricing assumptions that lifted FY27 and FY28 EBIT forecasts by 2%.
Is Wesfarmers considered a low-volatility stock?
Yes. Wesfarmers has a beta of 0.80, meaning it historically moves less than the broader market. This defensive characteristic makes it attractive for investors seeking stability alongside dividend income.
How do dividends affect the Wesfarmers stock price?
On ex-dividend dates, the Wesfarmers stock price drops by approximately the dividend amount. This is a mechanical adjustment, not a decline in company value. Total shareholder return, which combines price movements and dividend income, is the correct measure of overall performance.