

TL;DR:
- Tracking stock performance captures total return, including dividends, fees, and taxes, providing an accurate view of wealth growth.
- Regular monitoring prevents hidden risks like portfolio drift and supports disciplined rebalancing and decision-making.
Tracking stock performance means continuously monitoring the real returns and risk exposure of your investments so you can make data-driven decisions that build long-term wealth. Most investors watch price changes and stop there. That approach misses dividends, fees, taxes, and allocation drift, all of which quietly erode or inflate your actual results. Understanding why track stock performance matters goes far beyond checking a number on a screen. The investors who consistently outperform are the ones who measure what actually counts: total return, portfolio health, and whether their original investment thesis still holds.
Why track stock performance: what you're actually measuring
Stock performance tracking is the practice of monitoring total return, not just price appreciation. Dividends contribute approximately 40% of the total return of the S&P 500. That means an investor who tracks price only is ignoring nearly half of their actual gains or losses.
The gap between displayed returns and real returns is wider than most investors realize. Most brokerage platforms omit fees, foreign exchange costs, and dividend tax effects from the return figures they show you. What looks like a 12% annual gain may be closer to 9% after those drags are accounted for.
Tracking total return requires monitoring several components together:
- Price appreciation: the change in share price over your holding period
- Dividend income: cash distributions received, including reinvested dividends
- Fees and commissions: brokerage charges that reduce net gain
- Tax effects: capital gains tax and dividend withholding that affect after-tax return
- Currency effects: relevant for investors holding foreign-listed equities
Tracking dividend income trends also tells income investors whether their earnings are growing over time, which is a signal of portfolio health that price charts cannot show.
Pro Tip: Use a stock return calculator that incorporates dividends and timing to get a true picture of your total return, not just the price movement your brokerage displays.
How does portfolio drift create hidden risk?
Asset allocation drift is one of the most underappreciated risks in personal investing. Failure to consolidate all accounts creates "invisible drift," where your actual asset allocation may be significantly different from what you believe it to be. An investor targeting a 60% equity allocation may unknowingly be sitting at 75% or higher once old accounts, options positions, and employer stock plans are included.
Drift happens gradually and silently. A strong run in equities relative to bonds shifts your mix without any action on your part. Without consolidated tracking, you carry more risk than your plan intends, and you may not discover it until a market downturn reveals the damage.
Common sources of invisible drift include:
- Old employer retirement accounts not consolidated into a current portfolio view
- Options or warrants that add equity exposure without appearing as stock holdings
- Concentrated single-stock positions from equity compensation plans
- Sector overweights that build up as certain holdings outperform
Regular tracking enables timely rebalancing. Rebalancing brings your allocation back to its target, which controls volatility and keeps your risk profile aligned with your actual goals.
Pro Tip: Review your full consolidated allocation at least quarterly. Include every account, including old 401(k)s, IRAs, and taxable brokerage accounts, before concluding that your portfolio matches your intended mix.
What are the best practices for reviewing stock performance?
Review frequency is one of the most consequential decisions an investor makes. Financial experts recommend reviewing your portfolio 2–4 times per year. Reviewing more often increases the likelihood of emotional, reactive trading that reduces long-term returns.

The right review process covers more than raw numbers. Use both time-weighted return (TWR) and money-weighted return (MWR) for a complete picture. TWR evaluates the quality of your investment decisions by excluding the timing of cash flows, while MWR reflects your personal wealth change including when you added or withdrew funds. Both metrics tell you something different and both matter.
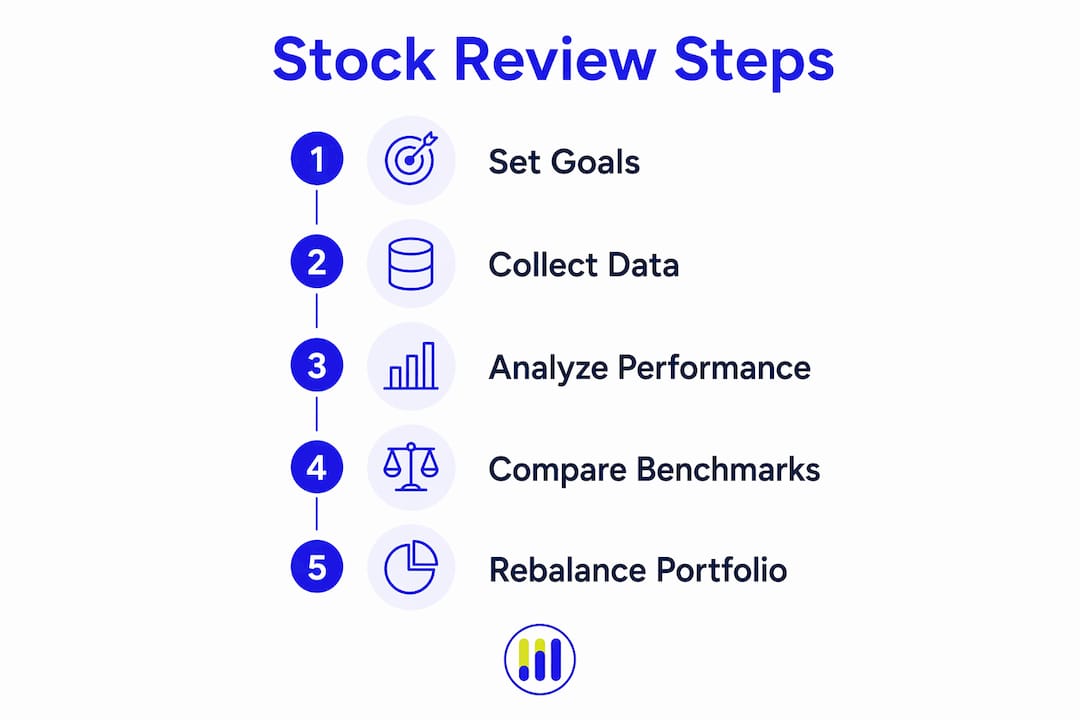
A structured quarterly review should follow this sequence:
- Calculate total return using TWR and MWR across all accounts
- Check allocation drift against your target mix and rebalance if needed
- Review each holding's investment thesis to confirm it still holds
- Assess dividend trends for income-focused positions
- Identify tax-loss harvesting opportunities before year-end
Monitoring should focus on whether the investment thesis is intact rather than reacting to short-term price moves. A stock that has fallen 15% is not automatically a sell. The question is whether the original reasons for owning it remain valid.
Pro Tip: Before each review, write down your expectations for each holding. Comparing your prediction to the actual result builds self-awareness and reduces the influence of hindsight bias.
How does tracking support better investment decisions?
Disciplined tracking converts raw data into decisions. Without it, investors rely on memory, gut feeling, and recency bias, all of which produce worse outcomes than a structured review process.
Cost basis tracking per tax lot is one area where tracking directly affects your after-tax return. Different accounting methods, including FIFO (first in, first out) and specific lot identification, produce different taxable gains on the same sale. Choosing the right method requires knowing your cost basis for every lot, which only systematic tracking provides.
Tracking also separates genuine winners from noise. A position that looks strong on price may be underperforming once dividends, fees, and currency effects are included. Conversely, a flat-looking position may be delivering strong dividend income that does not show up in a price chart. The importance of monitoring stocks becomes clear when you realize that price alone is an incomplete signal.
A written note explaining why a stock was trimmed, added, or sold reduces hindsight bias and emotional mistakes. Brief trade rationale notes, categorized by reason, build discipline over time and create a personal record that improves future decisions. This practice is one of the simplest and most underused tools available to individual investors.
Benchmarking against a blended index that reflects your actual asset allocation is also critical. Comparing a 60/40 portfolio to the S&P 500 alone produces a misleading result. Your benchmark should match your mix.
Key Takeaways
Tracking stock performance is the foundation of informed investing because it reveals total return, prevents hidden risk, and supports disciplined, data-driven decisions.
| Point | Details |
|---|---|
| Total return includes dividends | Dividends account for roughly 40% of S&P 500 returns; price tracking alone misses nearly half of actual performance. |
| Brokerage figures are incomplete | Fees, taxes, and currency effects reduce real returns below what most platforms display. |
| Consolidate all accounts | Invisible drift can push equity exposure well above your intended allocation without any deliberate action. |
| Review 2–4 times per year | More frequent reviews increase emotional trading; quarterly reviews support disciplined, long-term thinking. |
| Document every trade rationale | Written notes reduce hindsight bias and build the decision discipline that compounds over time. |
Tickerplace's take on why tracking is non-negotiable
Most investors believe they know how their portfolio is performing. After working with thousands of data points across US and ASX markets, the pattern at Tickerplace is clear: the investors who feel most confident about their returns are often the ones with the least accurate picture of them. They are tracking price. They are not tracking performance.
The single biggest mistake individual investors make is treating a brokerage account summary as a performance report. It is not. It is a snapshot of current value, stripped of the context that actually matters: what you paid, what you received in dividends, what you lost to fees, and whether your allocation still matches your risk tolerance.
Tracking does not need to be complex to be effective. A quarterly review using TWR and MWR, a consolidated view of all accounts, and brief written notes on each trade decision will put you ahead of the majority of retail investors. The goal is not a perfect system. The goal is a consistent one. Complexity is the enemy of consistency, and consistency is what compounds.
The investors who evaluate stock performance step by step with a repeatable process make fewer emotional errors and hold better positions longer. That discipline, more than any single stock pick, is what drives long-term results.
— Tickerplace
Put your tracking into practice with Tickerplace
Tickerplace provides free, institutional-grade tools built specifically for individual investors who want accurate, complete performance data without paying for a professional platform.

The stock average price calculator gives you an accurate cost basis across multiple purchase lots, which is the starting point for any real return calculation. The stock profit/loss calculator factors in commissions and fees so your net gain reflects what you actually earned, not just what the price chart shows. For investors who want to go further, Tickerplace's valuation tools use DCF, P/E, and P/S models to assess whether a stock is overvalued or undervalued right now, across more than 10,000 US and ASX-listed equities. Accurate tracking and sound valuation belong together. Tickerplace gives you both, at no cost.
FAQ
Why does tracking stock performance matter for long-term investors?
Tracking reveals total return, including dividends, fees, and tax effects, which gives a far more accurate picture of wealth growth than price alone. Investors who track comprehensively make better rebalancing and tax decisions over time.
How often should I review my investment portfolio?
Financial experts recommend reviewing your portfolio 2–4 times per year. More frequent reviews increase the risk of emotional, reactive trading that reduces long-term returns.
What is the difference between TWR and MWR?
Time-weighted return (TWR) measures the quality of investment decisions by removing the effect of cash flow timing. Money-weighted return (MWR) reflects your personal wealth change, including when you added or withdrew funds. Both metrics provide distinct and useful insights.
What is portfolio drift and why does it matter?
Portfolio drift occurs when your actual asset allocation shifts away from your intended target, often without any deliberate action. Failing to consolidate all accounts can push equity exposure significantly above your planned level, increasing risk without your awareness.
How does cost basis tracking affect my taxes?
Cost basis determines your taxable capital gain on every sale. Tracking cost basis per tax lot and choosing the right accounting method, such as FIFO or specific lot identification, can meaningfully reduce the tax you owe on profitable positions.