

TL;DR:
- Equity analysis evaluates a company's financial health and market factors to identify undervalued or overvalued stocks. It helps investors make disciplined decisions by estimating intrinsic value and timing entries and exits. Combining fundamental, technical, and sentiment analysis enhances investment accuracy and portfolio performance.
What is equity analysis and why does it matter?
Equity analysis is the process of evaluating a company's financial health, competitive position, and market factors to determine whether its stock is undervalued, overvalued, or fairly priced. The goal, as the CFA Institute frames it, is to estimate intrinsic value and identify mispriced securities, improving the risk-return trade-off of your portfolio relative to its benchmark. Without this process, buying and selling stocks is little more than informed guessing.
The reasons to analyze stocks go well beyond finding a bargain. Rigorous equity analysis replaces guesswork and sentiment-driven trades with disciplined selection and timing, which translates directly into better long-term portfolio performance. It also helps you recognize when a stock you already own has become overpriced, giving you a rational basis for selling rather than holding out of habit or hope.
The core benefits of analyzing equities include:
- Identifying mispriced stocks: Spotting securities trading below intrinsic value before the broader market corrects the price.
- Managing risk: Avoiding overvalued or financially unstable companies before they decline.
- Improving portfolio diversification: Allocating capital across sectors and risk levels based on evidence, not intuition.
- Timing decisions: Using valuation signals and market data to choose better entry and exit points.
- Aligning investments with goals: Matching stock selection to your time horizon, income needs, and risk tolerance.
The three main types of equity analysis
Professional investors rarely rely on a single method. Combining fundamental and technical analysis provides a more complete, though still imperfect, investment strategy than using either approach alone. Understanding each method helps you decide which tools fit your situation.
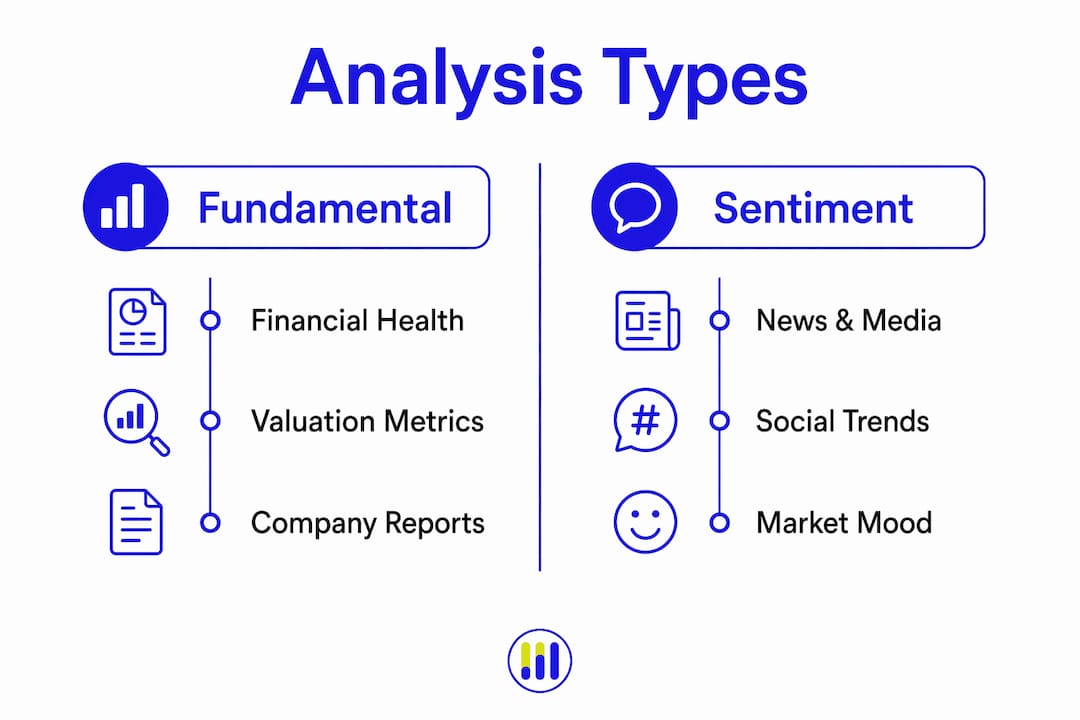
Fundamental analysis
Fundamental analysis examines a company's financial statements, business model, competitive advantages, and macroeconomic context to estimate its intrinsic value. Analysts review the income statement, balance sheet, and cash flow statement, then calculate ratios such as price-to-earnings (P/E), debt-to-equity, earnings per share (EPS), and return on equity (ROE). The objective is to answer one question: is this stock worth more or less than what the market currently charges?
Key inputs for fundamental analysis:
- Revenue growth and profit margins over multiple periods
- Debt levels and coverage ratios
- Free cash flow generation
- Management quality and corporate governance
- Industry dynamics and competitive positioning
Technical analysis
Technical analysis studies historical price movements and trading volume to forecast future price direction. Rather than asking what a company is worth, it asks where the stock price is likely to go next. Analysts use chart patterns, moving averages, Bollinger Bands, the Relative Strength Index (RSI), and support and resistance levels to identify potential entry and exit points. This approach is particularly useful for timing a purchase after fundamental research has already identified a stock worth owning.
Sentiment analysis
Sentiment analysis draws on news articles, social media, earnings call transcripts, and financial blogs, processing that data through machine learning and natural language processing to gauge investor mood. Shifts in sentiment can precede price movements, especially around earnings announcements or major corporate events. While sentiment data alone is rarely sufficient for a buy or sell decision, it adds a useful layer of context when combined with fundamental and technical findings.
| Analysis Type | Primary Focus | Typical Tools | Best Used For |
|---|---|---|---|
| Fundamental | Financial health and intrinsic value | P/E ratio, DCF, EPS, debt-to-equity | Long-term stock selection |
| Technical | Price and volume patterns | Moving averages, RSI, chart patterns | Entry and exit timing |
| Sentiment | Investor mood and market psychology | NLP models, news feeds, social data | Confirming or questioning a thesis |
Pro Tip: Use fundamental analysis to decide what to buy, then apply technical analysis to decide when to buy it. Layering both methods addresses the two biggest questions in stock investing.
How to apply equity analysis to your investment decisions
Equity analysis reduces information asymmetry by distilling complex financial data into clear signals that help individual investors align their holdings with personal financial goals. Translating that into practice requires a repeatable process.

Step 1: Define your investing goals. Before researching any stock, clarify your time horizon, income needs, and acceptable risk level. A retiree seeking dividend income will weight different metrics than a younger investor building long-term wealth.
Step 2: Research the company and its industry. Read the most recent annual report (10-K) and quarterly filings (10-Q). Understand how the company generates revenue, who its competitors are, and what external factors, including interest rates, inflation, and commodity prices, could affect its performance. Professional analysis integrates these macroeconomic factors for a complete view of stock potential.
Step 3: Evaluate key financial metrics. Calculate or look up the P/E ratio, price-to-sales (P/S) ratio, debt-to-equity ratio, and free cash flow yield. Compare these figures against industry peers and the company's own historical averages. A stock trading at a price-to-earnings ratio significantly below its industry peers may warrant closer investigation.
Step 4: Estimate intrinsic value. Use a discounted cash flow (DCF) model, a P/E-based valuation, or an asset-based approach to estimate what the stock is actually worth. The CFA Institute cautions that modest differences between estimated intrinsic value and market price may be noise rather than a genuine signal. A meaningful margin of safety, requiring the market price to sit meaningfully below your intrinsic value estimate, is what justifies acting.
Step 5: Make a disciplined buy, hold, or sell decision. Once your analysis is complete, set clear criteria for action. Stock screeners are useful for surfacing candidates but should never replace deeper analysis of fundamentals, competitive dynamics, and management quality.
Common mistakes to avoid:
- Treating a screener result as a buy signal without further research
- Overreacting to short-term price swings or news headlines
- Ignoring qualitative factors like management track record and brand strength
- Failing to revisit your thesis when new financial data becomes available
- Concentrating too heavily in one sector without diversification
Pro Tip: Reacting to pre-set valuation triggers is far more effective than responding to daily market noise. Build a watchlist with specific price and valuation thresholds, and act when those thresholds are met, not when headlines create urgency.
Tools and resources that support your equity analysis
Having the right tools shortens the gap between raw financial data and a confident investment decision. Tickerplace is a free stock valuation and market analysis platform built specifically for individual investors who want institutional-grade analysis without the institutional cost. Its multi-model valuation engine runs DCF, P/E, and P/S analysis simultaneously, generating intrinsic value estimates and fair value targets for more than 10,000 US and ASX-listed equities, updated daily.

Beyond individual stock valuation, Tickerplace provides sector and industry analysis, side-by-side stock comparison, and dedicated calculators for margin of safety, debt-to-equity, current ratio, and P/E ratio. The stock valuation checker gives you a direct answer to the most important question in equity investing: is this stock overvalued or undervalued right now?
Key resource categories every investor should use:
- Company filings: SEC EDGAR for 10-K and 10-Q reports, the primary source for financial statements.
- Valuation calculators: Tools that run DCF, P/E, and P/S models to estimate intrinsic value and margin of safety.
- Market data platforms: Real-time and historical price data, trading volume, and earnings calendars.
- Economic indicators: Federal Reserve data on interest rates, Bureau of Labor Statistics inflation figures, and GDP reports from the Bureau of Economic Analysis.
- News and sentiment feeds: Financial news aggregators and earnings call transcripts to track qualitative developments.
| Resource Type | What It Provides | Example |
|---|---|---|
| SEC filings | Audited financial statements and disclosures | 10-K, 10-Q on SEC EDGAR |
| Valuation tools | Intrinsic value and fair value estimates | Tickerplace DCF and P/E calculators |
| Economic data | Macro context for sector and stock analysis | Federal Reserve, BLS, BEA |
| Market data | Price history, volume, and technical indicators | Stock charts, earnings calendars |
| Sentiment sources | Investor mood and news-driven signals | Earnings transcripts, financial news |
A beginner's guide to fundamental analysis can help you understand how to read financial statements and apply valuation ratios before you run your first model. The goal is to build a repeatable workflow: gather data, run the numbers, apply judgment, and act on pre-set criteria rather than emotion.
Put your analysis into practice with Tickerplace

Tickerplace gives individual investors free access to the same valuation models professional analysts use. Run a DCF, P/E, or P/S valuation on any of 10,000+ US and ASX stocks, check your margin of safety, and compare companies side by side, all in one place. Start with the stock valuation calculator to see whether the stocks on your watchlist are priced fairly today.
Key Takeaways
Equity analysis is the most reliable way to move from guesswork to grounded investment decisions, combining financial data, valuation models, and market context to identify mispriced stocks.
| Point | Details |
|---|---|
| Analysis replaces guesswork | Rigorous equity analysis replaces sentiment-driven trades with disciplined stock selection and timing. |
| Three core methods | Fundamental, technical, and sentiment analysis each answer a different question; combining them gives the fullest picture. |
| Intrinsic value is the anchor | Estimating intrinsic value through DCF, P/E, or P/S models reveals whether a stock is worth buying at its current price. |
| Discipline beats reaction | Pre-set valuation triggers outperform emotional responses to daily market news, especially for beginner investors. |
| Free tools exist | Tickerplace provides multi-model valuation and comparison tools for 10,000+ equities at no cost. |
FAQ
Why is stock analysis important for individual investors?
Stock analysis helps individual investors make informed buy, hold, and sell decisions by replacing guesswork with evidence drawn from financial statements, valuation models, and market data. Without it, portfolio decisions default to emotion or market noise.
What does Warren Buffett say about technical analysis?
Warren Buffett has consistently favored fundamental analysis over technical analysis, focusing on a company's intrinsic value, earnings power, and competitive advantages rather than price charts or trading patterns.
What is the 7% rule in stocks?
The 7% rule is a common sell discipline suggesting investors cut losses when a stock falls below their purchase price by a small, predefined percentage, limiting downside before a loss compounds. It is a risk management guideline, not a valuation method.
Why should you analyze equities before investing?
Analyzing equities before investing helps you identify whether a stock is undervalued, overvalued, or fairly priced, reducing the risk of overpaying and improving the odds of achieving your financial goals over time.