
A valuation checklist turns raw filings into a defensible intrinsic-value range by following a fixed sequence: gather data, screen the business, run a discounted cash flow (DCF) plus a relative check, test your assumptions, and apply a margin of safety. The goal isn't a single perfect number; it's a range you trust enough to act on, built from at least two cross-checked methods like DCF and comparable multiples, using a tool such as Tickerplace to speed up the math. Run the ordered checklist below from start to finish.
TL;DR:
- Use at least two valuation methods, such as a discounted cash flow and a comparable multiples check, to build a reliable fair-value range.
- Ensure your assumptions for growth, discount rate, and terminal value are based on industry context and are tested for sensitivity, especially when terminal value dominates the valuation.
- Regularly revisit and update your valuation after any major company event or guidance change, and verify assumptions with primary sources like filings or government data.
- Be cautious of biases like anchoring or confirmation bias, and treat valuation outputs as ranges with appropriate safety margins rather than exact figures.
- Utilize tools like Tickerplace to streamline calculations and document assumptions, but rely on judgment for qualitative factors like management quality and governance.
The Step-by-Step Valuation Checklist
Treat this as a sequence, not a menu. Each step feeds the next, and skipping one usually shows up later as an unexplainable gap between your model and the market price.
- Gather your inputs. Pull the last three to five years of filings, current shares outstanding, recent management guidance, and analyst consensus estimates where available.
- Run a quick business quality screen. Before you touch a spreadsheet, ask whether the company has a durable moat, disciplined capital allocation, and manageable leverage. This is a pre-model filter, not busywork: experienced investors use these deal-breaker checks specifically to avoid sinking hours into modeling a business that has no real edge.
- Pick your models. At minimum, run a DCF and one relative multiple, such as P/E or EV/EBITDA. Add a dividend discount model (DDM) if the company has a long, stable dividend history. The CFA Institute's equity valuation framework treats model selection as its own deliberate step, not an afterthought.
- Build a base case and two alternates. Write down your central growth and margin assumptions, then build a conservative bear case and an optimistic bull case around them.
- Run the models and convert to per-share value. Take your total enterprise or equity value and divide by diluted shares outstanding to get a comparable per-share figure across methods.
- Set your range and apply a margin of safety. Blend your outputs into a plausible band, then discount that band by a safety margin before comparing it to the market price.
- Cross-check every DCF output against at least one multiple.
- Never rely on a single point estimate; intrinsic value works best as a range.
- Revisit your checklist after earnings releases or major guidance changes.
Pro Tip: Run your DCF and your relative multiple independently before comparing them. If you let the multiple "anchor" your DCF assumptions, you've just built one model wearing two masks instead of a genuine cross-check.
How DCF, Relative Multiples, and DDM Work
Each method answers a slightly different question, and that's exactly why using more than one matters.
DCF estimates intrinsic value by discounting projected future cash flows back to the present. You'll need to decide early whether you're forecasting free cash flow to the firm (FCFF, pre-debt) or free cash flow to equity (FCFE, post-debt), because that choice dictates your discount rate. The terminal value, which captures everything beyond your explicit forecast window, often ends up dominating the total. A small tweak to your terminal growth assumption can swing the whole valuation more than any single year of your forecast.
Relative valuation compares your target company to peers using normalized metrics: P/E, EV/EBITDA, P/S. The quality of this method depends entirely on picking genuinely comparable businesses, similar growth rate, similar margin profile, similar capital intensity, not just similar ticker sector.
DDM works only for companies with a consistent, well-established dividend, since it values the stock as the present value of expected future payouts.
- DCF: best for businesses with predictable, modelable cash flows.
- Relative multiples: best for a fast market-pricing sanity check.
- DDM: best as a secondary cross-check for mature dividend payers.
Used together, these three methods build a plausibility range rather than a single fragile number, which is precisely the point.
Setting Growth, Discount Rate, and Terminal Value Assumptions
Your assumptions do more to move the final number than your formulas do, so treat this step with real discipline.
Derive growth assumptions from a blend of historical revenue and earnings trends and industry benchmarks, adjusted for anything structurally changing in the business, a new product line, a shrinking addressable market, increased competition. Don't just extrapolate the last five years forward; ask whether those conditions still hold.
For the discount rate, estimate cost of equity using the Capital Asset Pricing Model (CAPM): a risk-free rate (typically a long-term government bond yield), a beta reflecting the stock's volatility relative to the market, and an equity risk premium. If you're discounting firm-level cash flows instead of equity cash flows, blend cost of equity and after-tax cost of debt into a weighted average cost of capital (WACC).
Discounting Consistency Principle: Discount cash flows to equity using cost of equity, and pre-debt firm cash flows using WACC. Mismatching the two is one of the most common and most damaging DCF errors retail models make.
- Keep terminal growth below long-term nominal GDP growth, not above it.
- Check what share of total value your terminal value represents; a very high share deserves extra scrutiny.
- Prefer primary sources: company filings, official government bond yields, and a tool like Tickerplace for pre-populated inputs where you want a faster starting point.
Sensitivity Checks and Red Flags Worth Catching Early
A single valuation output tells you almost nothing about how reliable it is. Sensitivity testing tells you everything.
- Build a small sensitivity table varying the discount rate and terminal growth rate by half a point in each direction, then look at how much your fair value swings.
- Calculate terminal value as a percentage of total DCF value. In many DCF models, terminal value ends up carrying the bulk of the total valuation, which means small terminal assumptions deserve outsized scrutiny.
- Compare your implied multiples back against peer and market multiples. A big gap needs an explanation, not a shrug.
- Apply your margin-of-safety threshold only after you've reconciled any major discrepancies between methods.
Pro Tip: If your DCF and your relative-multiple estimate disagree by more than 20 to 30%, don't average them and move on. Figure out which assumption is driving the gap, growth, margin, or multiple selection, before you trust either number.
Large swings from small assumption changes are the clearest sign of a fragile valuation, not a precise one.
Running the Checklist With Tools That Save the Work
You don't need a dozen spreadsheets open to execute this checklist properly. Tickerplace maps its calculators directly to each step: an intrinsic value calculator handles the DCF math, a P/E ratio calculator runs the relative-multiple check, and a combined stock valuation calculator lets you see P/E and intrinsic-value outputs side by side.
Once your models are built, save your assumptions somewhere you'll actually revisit, a note attached to the model, a dated spreadsheet tab, whatever sticks. Update your valuation on a quarterly cadence at minimum, and immediately after any material event: an earnings surprise, a guidance cut, a large acquisition.
- Input financials and current price into your chosen tool.
- Adjust growth, discount rate, and terminal value to your own assumptions rather than accepting defaults blindly.
- Save the output alongside the date and the reasoning behind your key assumptions.
- Revisit and update quarterly or after material company news.
| Checklist step | Tool that handles it |
|---|---|
| DCF and intrinsic value | Intrinsic value calculator |
| Relative multiple check | P/E ratio calculator |
| Combined multi-model view | Stock valuation calculator |
| Fast over/undervalued read | Stock valuation checker |
When assumptions shift materially, go back to primary filings rather than trusting a stale consensus estimate.
Why Management Quality and Governance Belong in the Checklist
A discount rate can't fully capture the risk of a management team that misallocates capital, and that's exactly why this step earns its own place in the checklist rather than getting folded into "qualitative notes."
Start with capital allocation history. Has management funded growth at reasonable returns, or has it chased acquisitions that destroyed value? A pattern of writedowns following acquisitions is a warning sign worth weighing heavily.
Look at insider ownership and insider buying or selling patterns. Meaningful, sustained insider ownership tends to align incentives with long-term shareholders more than a management team compensated purely on short-term stock performance.
Check board independence and the structure of executive compensation. Are pay incentives tied to metrics that reward genuine long-term value creation, like return on invested capital, or metrics that are easy to game in the short term, like adjusted EBITDA targets set with generous add-backs?
Governance red flags rarely show up cleanly in a spreadsheet. A related-party transaction buried in the footnotes, a history of restating earnings, or unusually high executive turnover all deserve a discount to your confidence level, even if they don't map neatly to a specific line item in your model. When you find one, it's often more honest to widen your margin of safety than to try to model the risk precisely.
Adjusting for One-Time Items and Non-Recurring Expenses
Reported earnings and reported free cash flow are rarely clean, and treating them as clean is one of the fastest ways to build a distorted valuation.
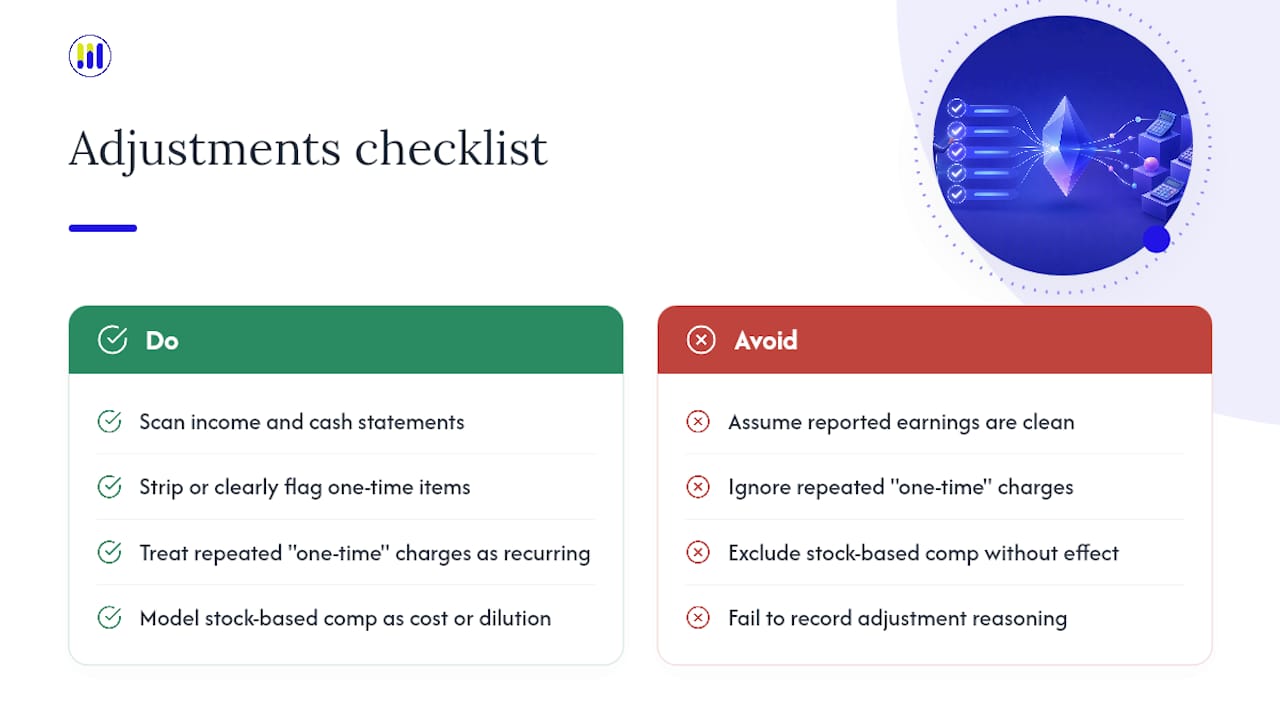
Start by scanning the income statement and cash flow statement for restructuring charges, asset impairments, litigation settlements, and gains or losses on asset sales. These items genuinely occurred, but they don't reflect the ongoing earnings power of the business, so they need to be stripped out or clearly flagged before you build forward projections off historical margins.
Be equally careful with the opposite problem: companies that label recurring costs as "one-time" year after year. If a business reports a restructuring charge in four consecutive years, that's not one-time, it's a structural cost you should bake into your baseline forecast rather than add back.
Stock-based compensation deserves its own scrutiny. Many companies exclude it from adjusted earnings, but it's a real economic cost that dilutes existing shareholders over time. For a DCF built on free cash flow, either treat it as a cash expense or explicitly account for the dilution in your per-share calculation, don't just ignore it because management's own presentation does.
Document every adjustment you make and why. If you're normalizing three years of restructuring charges out of your baseline, note the dollar amounts and the reasoning, so future-you (or a tool tracking your saved assumptions) can revisit whether that judgment still holds.
Reading Your Valuation Against Industry and Economic Conditions
A fair-value estimate means little in isolation. It has to be read against the environment the business actually operates in.
Interest rate conditions directly affect your discount rate, and by extension, every valuation you produce. A DCF built during a period of low government bond yields will show structurally higher fair values than the same model built when rates are elevated, holding all else equal. That's not a flaw in the model; it's the model correctly reflecting the cost of capital at that moment.
Industry cycle position matters just as much. A cyclical business, homebuilders, commodity producers, semiconductor manufacturers, will show inflated "normal" earnings at the peak of a cycle and depressed earnings at the trough. Normalize your base-case earnings across a full cycle rather than anchoring to the most recent year, especially for relative multiples, which are particularly sensitive to where in the cycle current earnings sit.
Compare your implied multiple not just to direct peers but to the sector's historical range. A stock trading at what looks like a discount to peers might simply be trading in line with a sector that the market has re-rated downward for structural reasons, slowing growth, regulatory pressure, technological disruption. Context determines whether that gap represents opportunity or a fair reflection of deteriorating fundamentals.
Common Pitfalls and Biases That Distort Valuations
Most flawed valuations aren't the result of bad formulas. They're the result of predictable human biases creeping into supposedly objective inputs.
Anchoring bias shows up when you let the current market price influence your "independent" fair-value estimate. If you already know a stock trades at $150, it's remarkably easy to unconsciously nudge your assumptions until your model lands somewhere near $150, defeating the entire purpose of the exercise.
Confirmation bias is just as common: once you've decided you like a company, you start searching for assumptions that justify a higher valuation rather than testing whether your assumptions are actually reasonable. Building your bear case before your bull case can help counteract this.
Overprecision is another frequent trap. A DCF that spits out a fair value of $147.32 looks rigorous, but that level of decimal precision is an illusion given how sensitive the inputs are. Present a range, not a single number to the penny.
Finally, watch for survivorship and recency bias in your comparable set. If your peer group only includes companies that survived and thrived, you're implicitly excluding the failures that a truly representative sample would include, which skews your relative multiples optimistic. And leaning too heavily on the last one or two years of data, rather than a full business cycle, tends to compound whatever conditions happen to be prevailing right now.
Calculating Free Cash Flow Accurately for a DCF
Free cash flow is the fuel for your entire DCF, and small errors here compound across every year of your forecast.
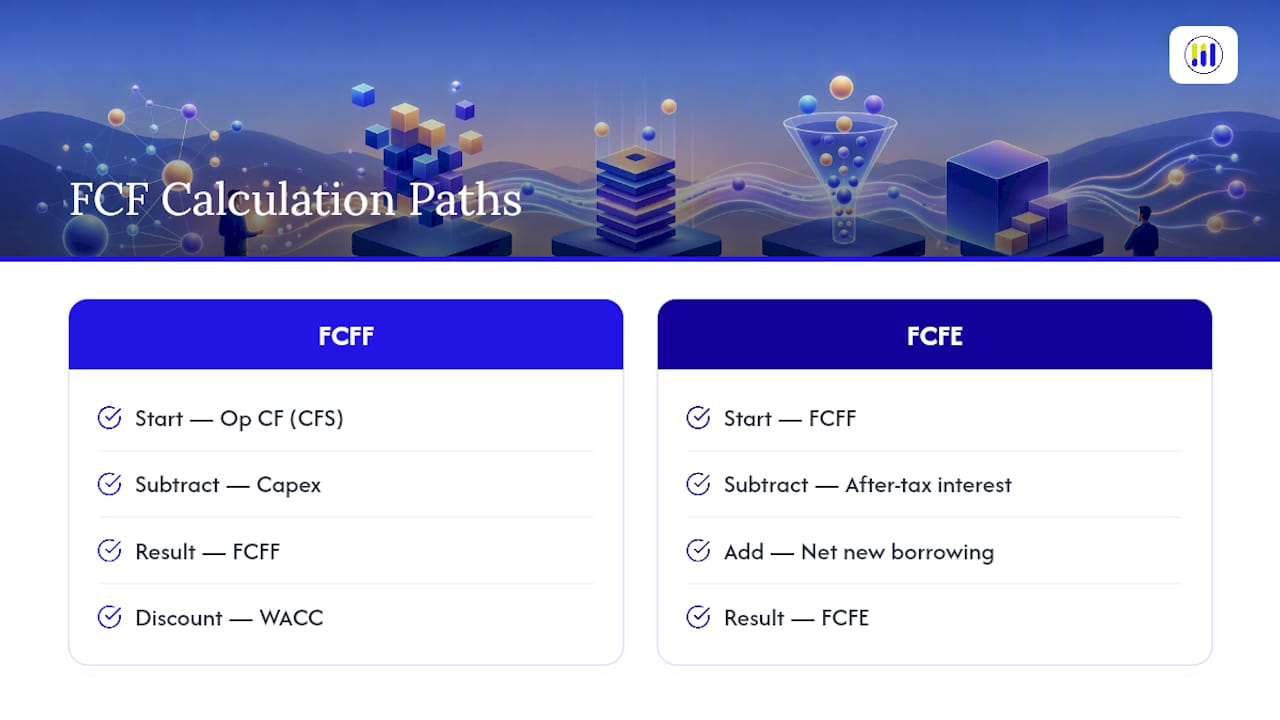
Start with operating cash flow directly from the cash flow statement rather than reconstructing it from net income, it's cleaner and already reflects working capital changes. From there, subtract capital expenditures to reach free cash flow to the firm, before financing activities.
Be precise about which free cash flow you're calculating. FCFF (free cash flow to the firm) excludes the effects of debt financing and gets discounted at WACC. FCFE (free cash flow to equity) starts from FCFF, subtracts after-tax interest expense, and adds net new borrowing, then gets discounted at cost of equity. Mixing these up, as Damodaran's valuation basics repeatedly warns, is one of the most common and costly DCF errors.
Watch working capital swings carefully, especially for businesses with seasonal inventory builds or rapidly changing receivables. A single unusual quarter can distort your trailing twelve-month free cash flow figure significantly if you're not normalizing for it.
For capital-intensive businesses, separate maintenance capex from growth capex where filings allow it. A company investing heavily in new capacity looks like it's generating weak free cash flow today, but that reinvestment may be exactly what drives the growth your model is forecasting. A financial due diligence checklist covering these adjustments in more depth is worth reviewing before you finalize your cash flow build.
Why Experienced Investors Never Skip the Checklist
A checklist isn't bureaucracy, it's the fastest filter for avoiding wasted work on companies that don't deserve a full model. Experienced investors run the disqualifiers first precisely because modeling a business with a fragile balance sheet or no real moat wastes hours that could go toward a better idea.
Tickerplace exists to make that discipline faster to execute, with institutional-grade models across DCF, P/E, and P/S, covering thousands of US and ASX-listed companies with daily updates. Stay conservative in your assumptions and write them down. A documented, slightly cautious estimate beats a precise-looking number you can't defend six months later.
— Tickerplace
Start Running Your Checklist With Tickerplace's Free Tools
Every step in this checklist maps to a specific calculator, so you're not rebuilding formulas from scratch every time you research a new name. The intrinsic value calculator handles your DCF build, the P/E calculator runs your relative check, and the combined stock valuation calculator lets you view both outputs together instead of toggling between spreadsheets.

The free tier covers the core workflow: intrinsic value estimates, P/E and P/S multiples, and margin-of-safety math across more than 10,000 US and ASX-listed equities, updated daily. Tickerplace Pro adds scenario analysis for building out bear and bull cases side by side, plus historical financials so you can normalize multi-year trends instead of eyeballing a single annual report. If you want a fast first read before committing to a full model, run the ticker through the stock valuation checker to get an immediate over- or undervalued signal, then build out the full checklist from there.
Sources
For readers who want to go deeper on any single step in this checklist, three sources stand out for rigor and clarity.
- Aswath Damodaran — Valuation introduction (Spring 2026)
- CFA Institute — Equity valuation: applications and processes
- Investopedia — What is intrinsic value?
This article is general information, not a substitute for advice from a qualified financial advisor. Consult a qualified financial professional about your own circumstances before acting on anything here.
FAQ
What Is a Valuation Checklist?
A valuation checklist is an ordered sequence of steps, gathering data, screening business quality, running DCF and multiples, testing sensitivities, and applying a margin of safety, that turns raw financial data into a defensible fair-value range.
How Many Valuation Methods Should I Use?
Use at least two: a DCF for an intrinsic anchor and one relative multiple, like P/E or EV/EBITDA, for a market-pricing check; add a DDM if the company pays a consistent dividend.
What Discount Rate Should I Use in a DCF?
Use cost of equity for cash flows to equity, or WACC for pre-debt firm cash flows, estimated through CAPM inputs like the risk-free rate, beta, and equity risk premium; never mix the two cash-flow types with the wrong rate.
How Do I Know If My Valuation Is Reliable?
Run a sensitivity table across your discount rate and terminal growth assumptions; if small changes swing your fair value dramatically, treat the output as a wide range rather than a precise number, and apply a margin of safety before acting.
Can Tickerplace Replace a Full Manual Valuation Model?
Tickerplace's calculators automate the DCF, P/E, and P/S math behind each checklist step, letting you focus on setting sound assumptions rather than rebuilding formulas, though scenario analysis and historical financials require the Pro tier for full depth.