
Finding a stock valuation tool that delivers reliable, transparent estimates for undervalued stocks is harder than it should be. Many platforms lock advanced screening features or deep historical data behind paid tiers and restrict coverage to US equities or basic ratios. This comparison outlines price, transparency, and feature access across five stock valuation tools so individual investors can match a product to their research style.
Table of Contents
Tickerplace
At a Glance
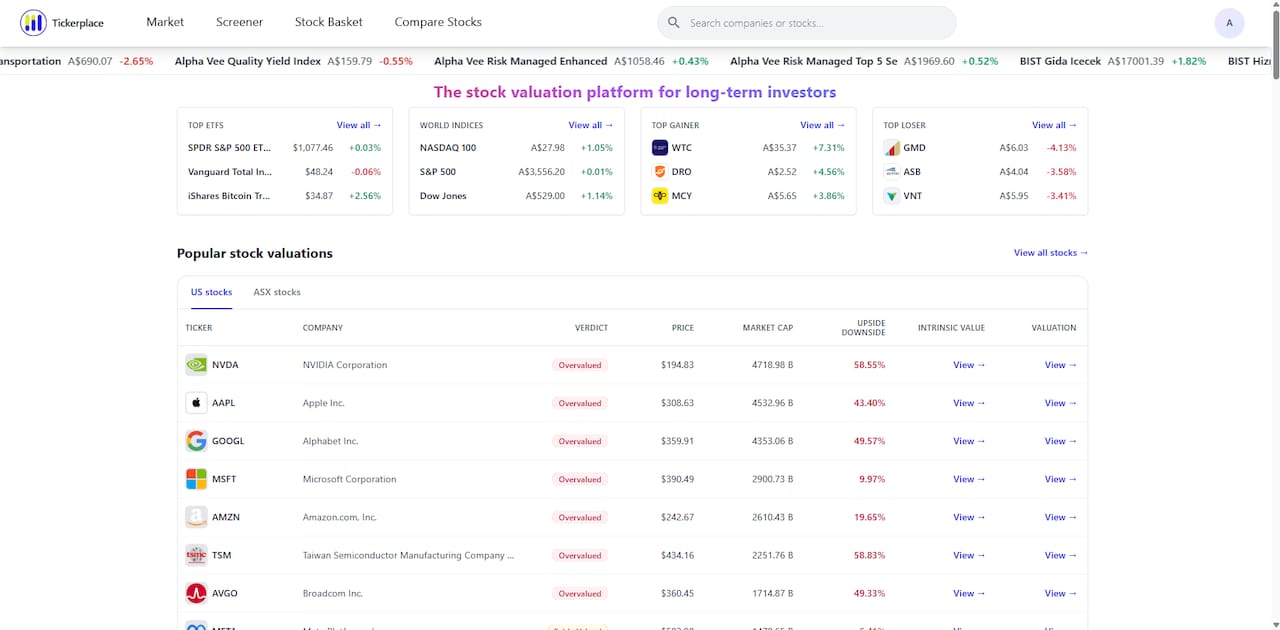
Tickerplace reports coverage of 10,000+ stocks across US and Australian markets. The platform updates multi-model valuation outputs daily to produce intrinsic value estimates and fair value targets. It positions itself for long-term investors who want transparent valuation math rather than headline price alerts.
Core Features
The site includes a stock screener with 60+ filters for fundamentals and technicals. It also offers a stock comparison tool that places companies side by side for direct metric checks. Built by Alphacentric Technology, Tickerplace provides intrinsic value and fair value checkers plus valuation calculators for DCF, P/E, and PEG ratios.
Key Differentiator
Tickerplace centers on structured multi-leg valuation models with a transparent methodology and real-time market data integration. The platform combines DCF outputs with P/E and P/S ratio analysis so the intrinsic value estimate reflects multiple valuation lenses. That layered approach clarifies why a stock looks undervalued or overvalued rather than delivering a single black-box number.
Pros
Tickerplace bundles free valuation tools that let you run DCFs and ratio checks without a paywall for basic use. The site integrates sector and industry analysis with side-by-side comparison so you can benchmark a candidate against peers in one view. Bookmarkable filter configurations and stock baskets simplify recurring screens, while educational guides explain model assumptions and inputs.
Cons
- Advanced historical data and deeper premium data sets require the paid plan, which limits research depth on the free tier.
Who It’s For
Individual investors focused on long-term value who want to test intrinsic value scenarios before committing capital. Investors who favor number-driven analysis over sentiment signals will find the valuation calculators useful. Beginners can learn valuation concepts; experienced investors can run quick multi-model checks.
Unique Value Proposition
Daily multi-model valuation outputs generate intrinsic value estimates that pair DCF math with ratio-based checks. That setup reduces reliance on a single metric and highlights which assumption drives the fair value shift. For investors building a margin-of-safety framework, this produces repeatable, explainable estimates for position sizing.
Real World Use Case
A retail investor compares Apple and Tesla using the side-by-side tool, runs DCF scenarios with conservative growth, and checks P/E and PEG ratios to confirm valuation divergence. They save the filter set as a stock basket to monitor fair value changes weekly. The saved configuration helps track reentry points when intrinsic value gaps widen.
Pricing
Tickerplace offers a free basic plan with limited features and access to core valuation tools. A premium subscription unlocks full access to advanced analytics, deeper historical data, and complete toolsets for $8/month. The free tier is sufficient for initial screening; the premium plan expands research depth.
Website: https://tickerplace.com
TIKR
At a Glance
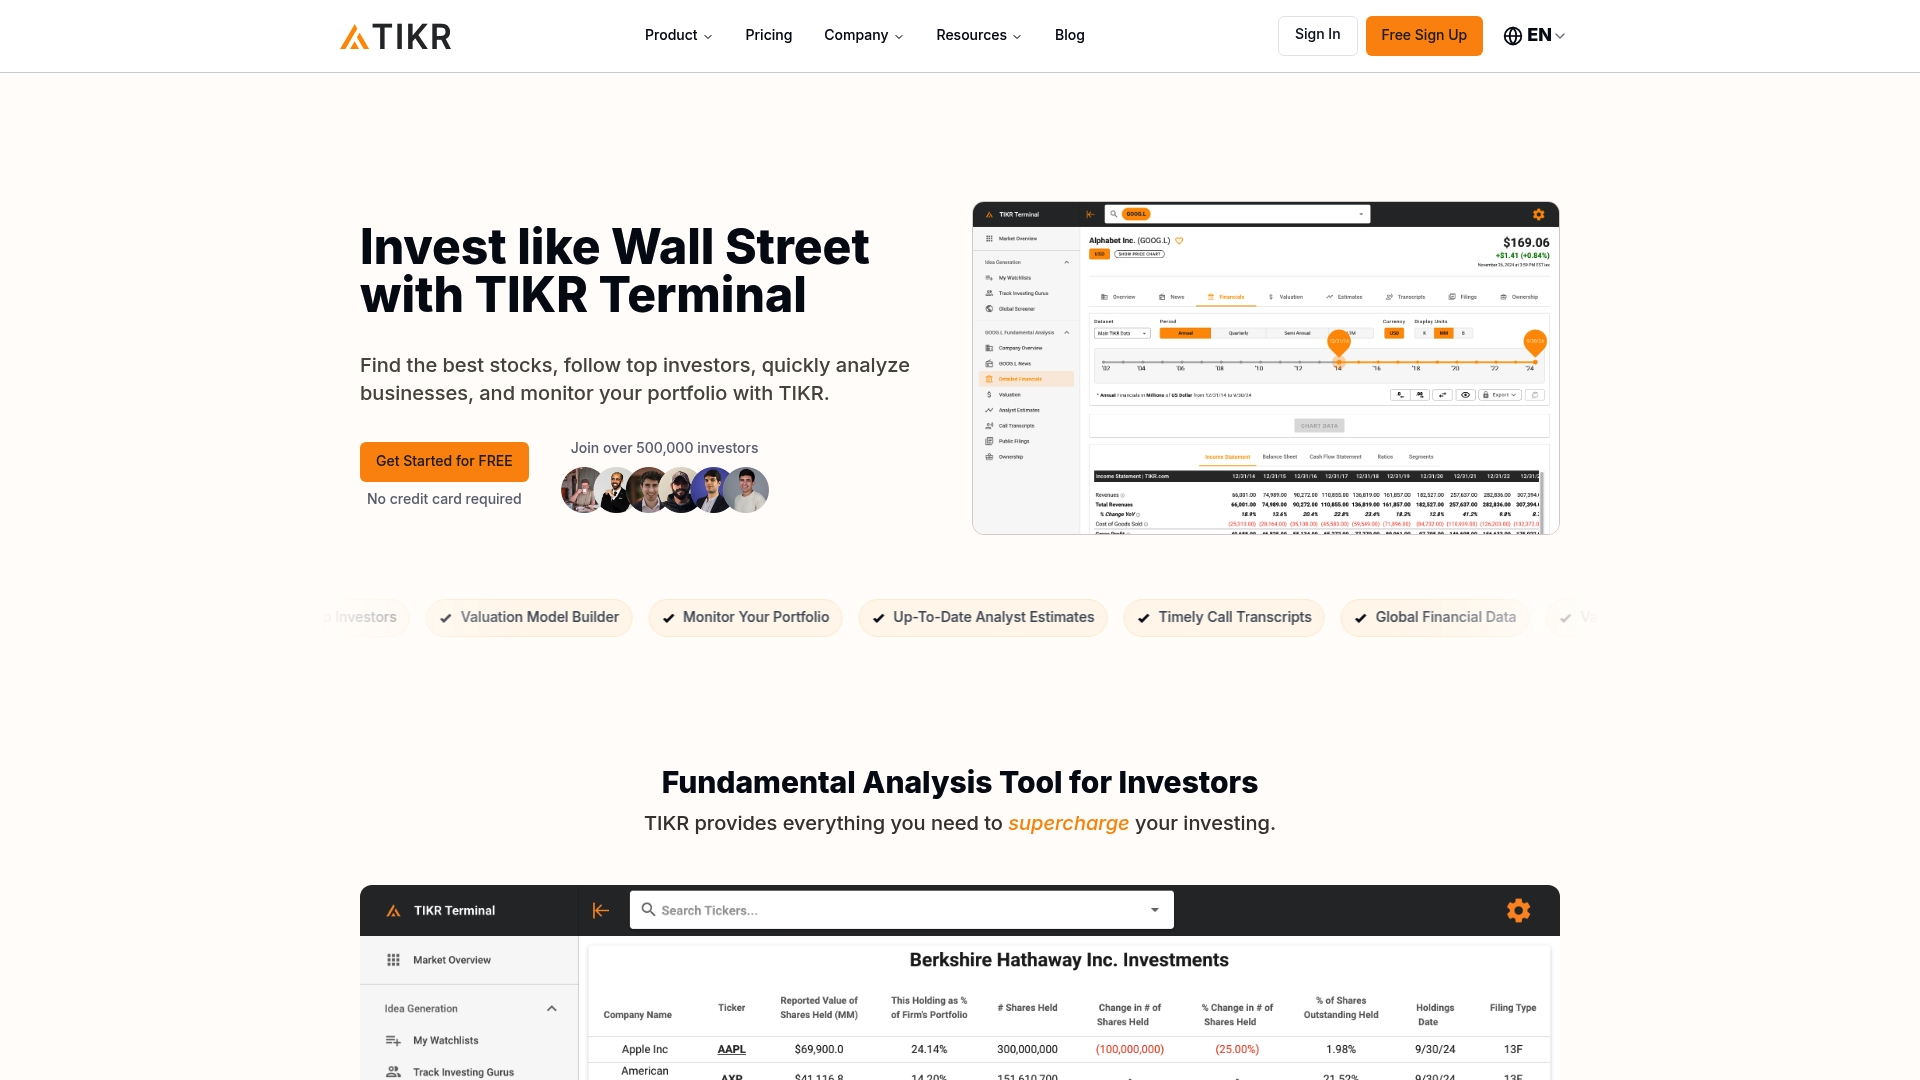
TIKR reports coverage of 100,000+ stocks across 92 countries and 136 exchanges. The platform emphasizes detailed company financials, analyst estimates, earnings call transcripts, and portfolio tracking. That combination targets investors who want deep, tradable research without paying institutional prices.
Core Features
TIKR delivers global financial statements, analyst forecasts, and valuation multiples alongside screening tools with thousands of filters. The platform includes portfolio monitoring, real-time news, earnings transcripts, and the ability to follow disclosed holdings of top investors. Custom valuation models and extended historical data appear in higher tiers for deeper backtesting and scenario analysis.
Key Differentiator
The vendor advertises institutional-quality data and earnings transcripts tailored for individual investors at a fraction of Bloomberg costs. This mix of transcript access, investor-holdings tracking, and broad global coverage defines TIKR’s position versus retail tools that only cover price data.
Pros
TIKR’s interface organizes detailed financials and forecasts so you can move from ratio screening to model inputs in a few clicks. The platform includes transcripts and top-investor holdings that help you read management tone and monitor institutional moves. TIKR reports some plans include historical data extending up to 20 years, which supports longer-term valuation work and performance reviews.
Cons
-
Some advanced datasets and lengthy transcript histories require Plus or Pro subscriptions, which limits the free tier.
-
Third-party reviewers note depth gaps compared with dedicated professional vendors, so expert users may still need alternative sources.
-
Data quality depends on aggregated sources and may show gaps for smaller markets or thinly covered stocks.
-
Free access restricts historical depth and universe coverage to a narrower set of US stocks.
When It May Not Fit
If you need the absolute deepest archival filings or the broadest institutional data feeds, TIKR may not match high-end terminals. Teams that require direct vendor support and custom data feeds will find TIKR’s delivery focused on self-service. Casual investors who only need current price charts and simple watchlists will find many features behind a paywall.
Who It’s For
TIKR fits individual retail investors and small advisory teams that perform fundamental analysis and build intrinsic value models. It also suits investors who want to follow hedge fund filings and earnings call transcripts without paying institutional rates. Analysts who require long historical series should pick Pro plans that include extended archives.
Real World Use Case
An investor screens for undervalued industrials using revenue growth and return on capital filters, then opens company transcripts to assess management commentary. They build a custom discounted cash flow model directly from TIKR financials and set alerts for upcoming earnings and filings. The investor then monitors disclosed moves by large funds to inform position sizing and timing.
Pricing
TIKR offers a Free tier plus two paid tiers. The vendor lists Plus at $17.95/month or $24.95/month undiscounted and Pro at $37.95/month or $54.95/month undiscounted, with annual billing discounts available. Higher tiers unlock longer historical data, transcript access, and more screening filters.
Website: https://tikr.com
FinMav.ai
At a Glance
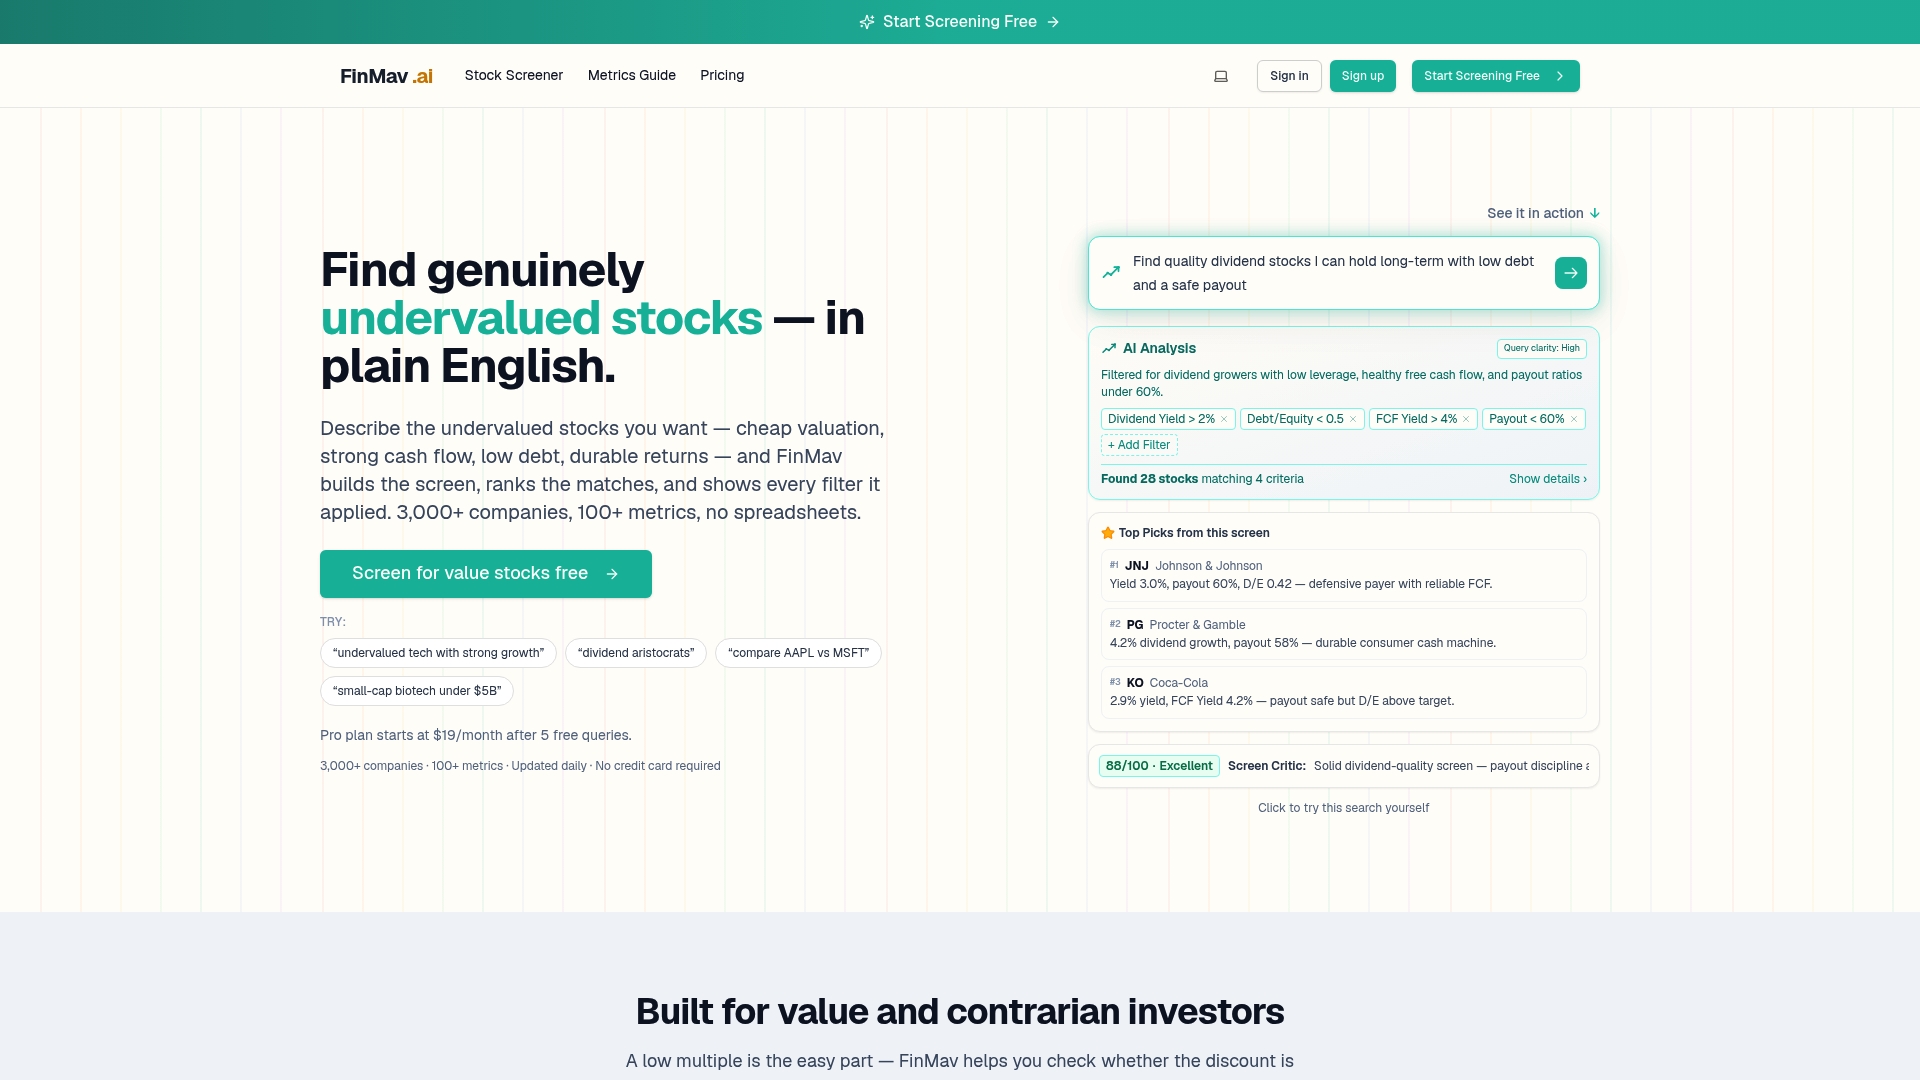
FinMav.ai reports coverage of over 3,000 US companies and more than 100 fundamental metrics for screening. The tool accepts plain English prompts to build screens. It also flags deteriorating fundamentals so investors avoid simple value traps.
Core Features
FinMav.ai combines natural language screening with a broad metric set and automated checks for balance sheet health. The platform explains each filter and the reasoning behind a match so you can judge whether a low valuation is justified. It also exports results, saves watchlists, and supports CSV export for offline work.
Key Differentiator
The standout feature is the platform’s emphasis on transparent reasoning. Screens come with step by step explanations of filter criteria and automatic flags where fundamentals are worsening. That combination makes it easier to separate cheap stocks from genuine bargains.
Pros
The plain English query model simplifies screening for investors who do not write technical formulas. The explanation layer clarifies why a company passes or fails a screen, which helps you audit the logic quickly. Automatic detection of value traps reduces the chance of buying a company with worsening fundamentals. The vendor offers a free trial of queries and an entry price point that keeps the tool accessible for many retail investors.
Cons
-
Limited to US listed stocks only. This excludes investors seeking international exposure.
-
Subscription required for unlimited screening and saved features, which may deter very casual users.
-
Relies on third party data from Financial Modeling Prep, which introduces a dependency outside the vendor’s control.
When It May Not Fit
If you need global coverage across Canada, Europe, or Asia, this product will not meet that requirement. Very occasional investors who only run a few screens may find the subscription cost hard to justify. Teams that require proprietary data feeds or guaranteed data ownership should look elsewhere.
Who It’s For
Value and contrarian investors who want a readable, data backed way to locate undervalued stocks will find this useful. It suits investors who prefer clear explanations of screening logic over opaque filters. The tool matches individual investors and small research teams focused on US equities.
Real World Use Case
An investor screens for dividend growth and low price to book using plain English queries. They review the platform’s explanations for each candidate, discard names flagged for deteriorating cash flow, and export the remaining names to a CSV watchlist. The result is a curated list of candidates ready for deeper due diligence.
Pricing
The Pro plan starts at $19/month and includes unlimited screening, saved screens, watchlists, CSV export, and priority support. The vendor also provides a free trial of queries so you can test the screening flow before subscribing.
Website: https://finmav.ai/value-stock-screener
Ideaft
At a Glance
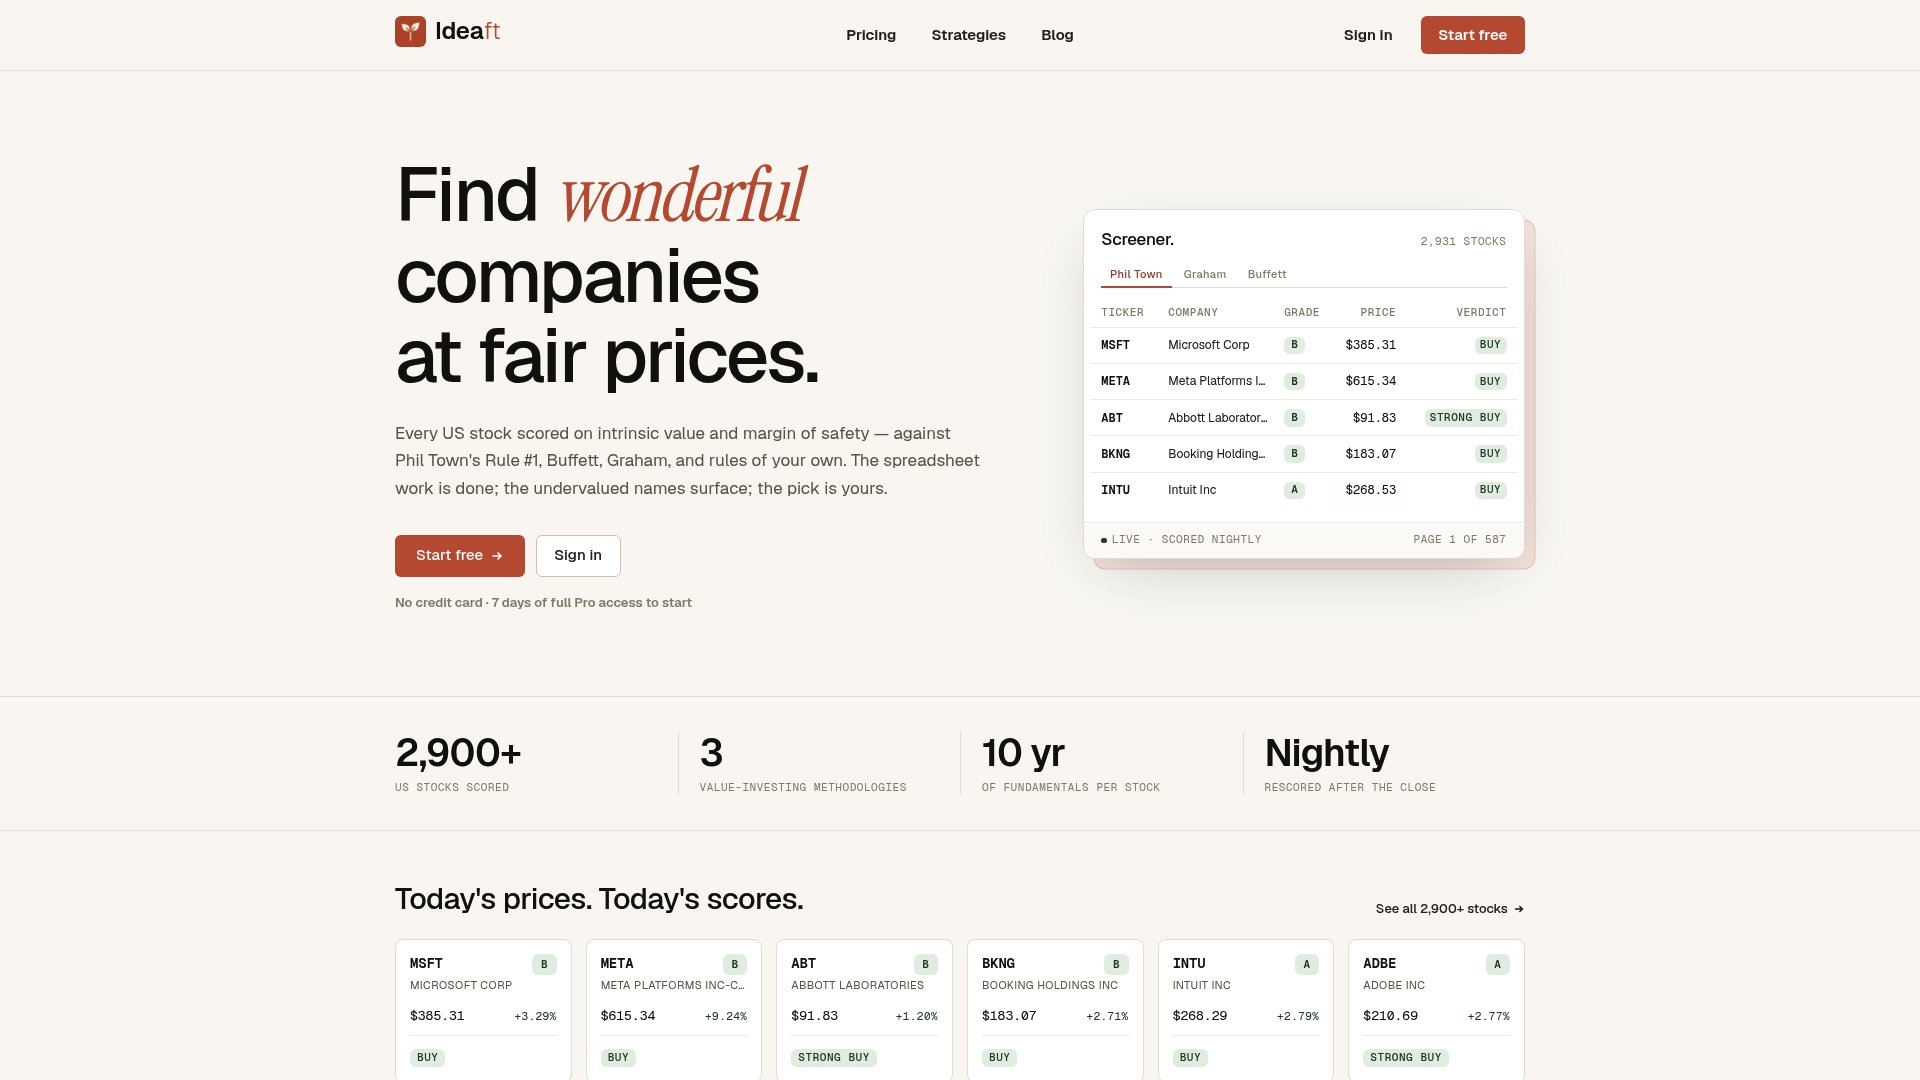
Ideaft reports scoring over 2,900 US stocks nightly, using valuation rules inspired by Phil Town, Warren Buffett, and Benjamin Graham. It delivers daily score updates and email summaries that flag changes to watchlists. The platform offers a free tier and a seven day Pro trial for portfolio tracking and custom strategies.
Core Features
The screener calculates intrinsic value, fair value, and margin of safety for covered US stocks and updates those figures each night. Users can apply three value frameworks and build bespoke rules that combine metrics like owner earnings, P/E, and payout ratio. Pro accounts add live portfolio tracking, FIFO cost basis updates, and real time quotes for positions.
Key Differentiator
Ideaft scores every covered US stock nightly using multiple classic value methodologies while letting you codify your own screening rules. That dual approach pairs systematic coverage with user-tailored filters so investors can compare framework outputs side by side.
Pros
Ideaft automates complex valuation math tied to familiar investing frameworks, freeing you from spreadsheet assembly and manual data pulls. The free forever screener and watchlist lower the barrier for retail investors to test value-based strategies. Nightly scoring across major US listings keeps signals current for long term selection and tactical buys.
Cons
-
Limited to US equities at launch. International markets are not supported.
-
Pro features require a paid subscription after the seven day trial, which may deter budget-conscious investors.
-
Analysis focuses on fundamentals from national exchanges. It does not provide technical or alternative data.
-
Some features assume familiarity with value investing concepts and may overwhelm complete novices.
When It May Not Fit
If you need exposure to international or small foreign listings, this product will not serve that requirement. If you rely on technical indicators or alternative data sets, the platform’s fundamental focus will feel narrow. Cost-sensitive investors who cannot use Pro features after the trial may find the free tier limiting for portfolio tracking.
Who It’s For
Individual retail investors who practice value investing and understand basic fundamental metrics will benefit most. Investors who want to test Buffett, Graham, or Rule #1 frameworks against a broad US coverage list will find Ideaft useful. Those seeking hands-on spreadsheet modeling or global coverage should look elsewhere.
Real World Use Case
A retail investor runs nightly screens across Ideaft to flag companies with a large margin of safety under Buffett style owner earnings. They save promising names to a watchlist, build a custom rule to exclude high leverage, and use daily emails to monitor verdict changes. When a watchlist name moves below intrinsic value, they review filings and consider adding to their portfolio.
Pricing
Free tier available for basic screening and watchlists. Pro costs $15/month after a seven day free trial and unlocks portfolio tracking, custom rules, and live quotes. The billing model is subscription based with a single paid tier.
Website: https://ideaft.com
StockPik
At a Glance
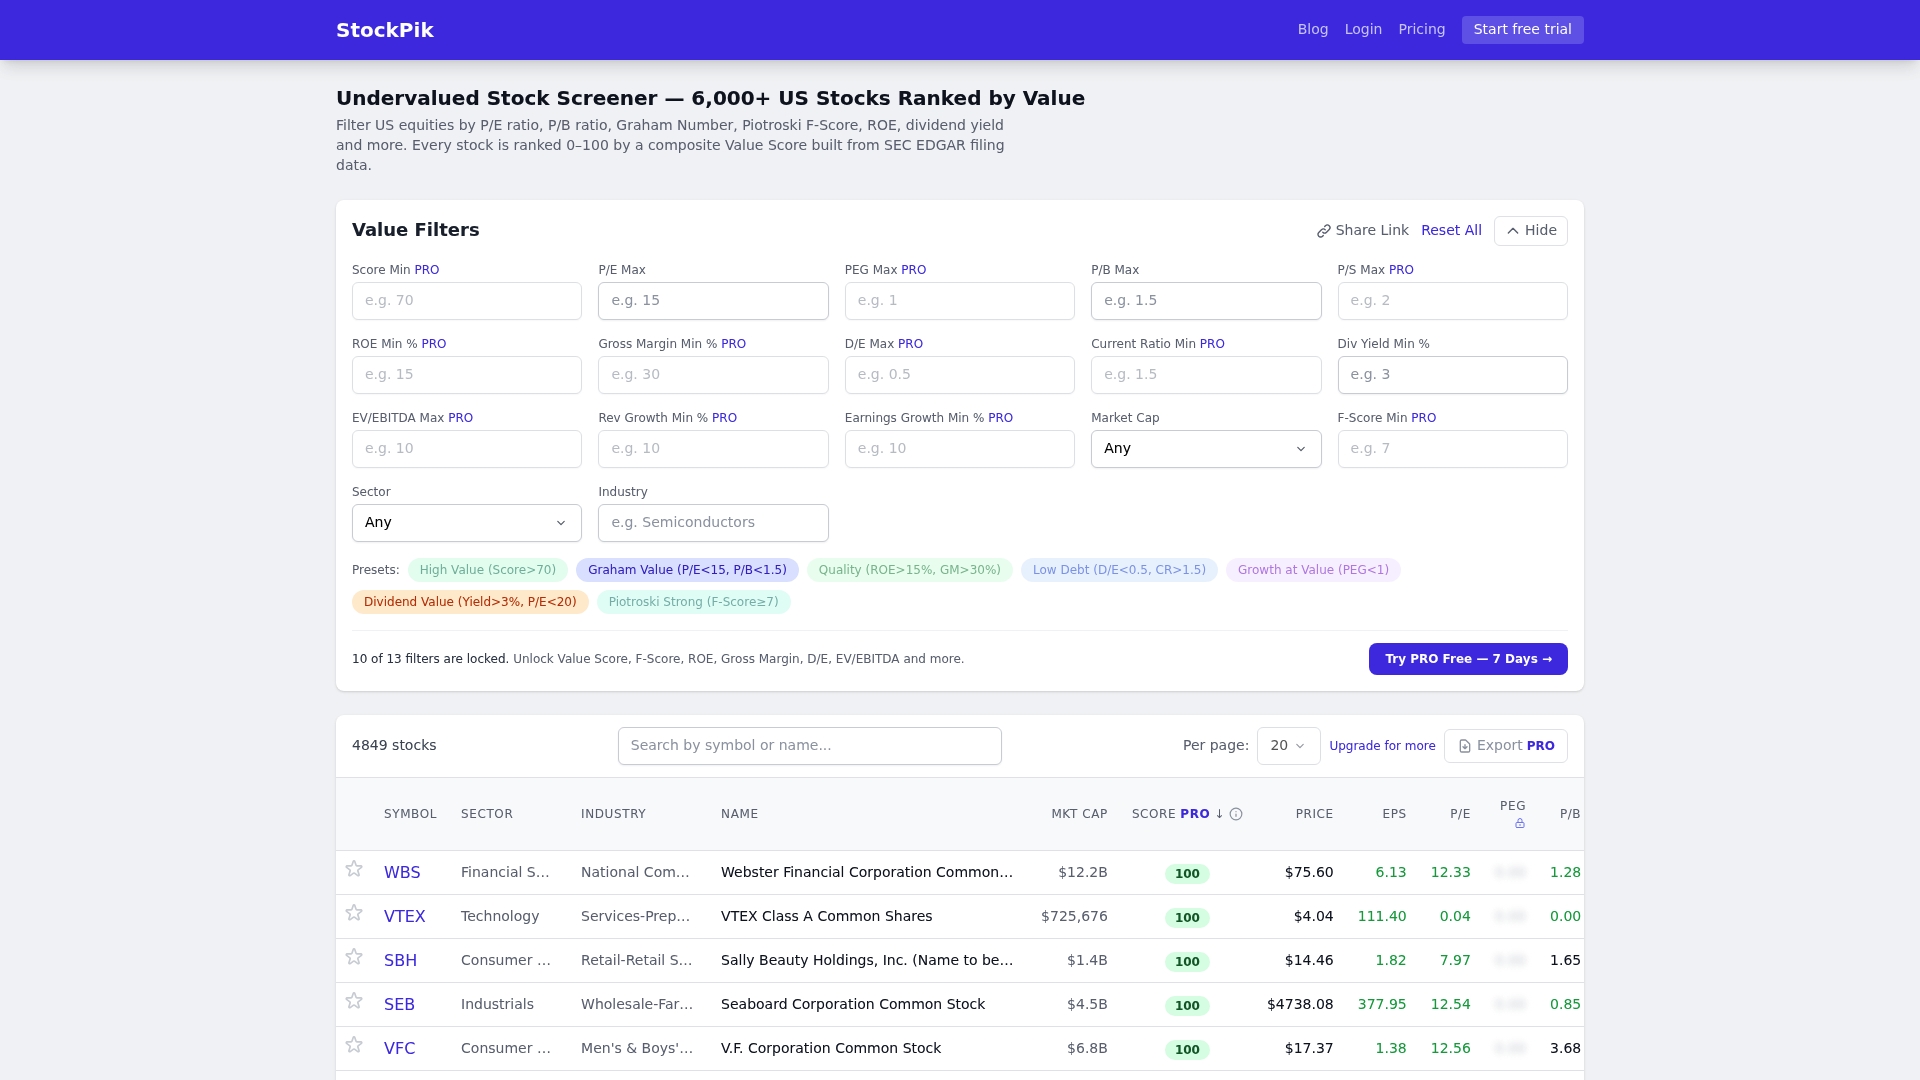
StockPik reports it ranks over 6,000 US stocks by a composite Value Score that uses only official SEC filings and market data. The score runs 0 to 100 and highlights names that score above 70 as potentially undervalued. The system flags value candidates without relying on analyst forecasts or scraped third party data.
Core Features
The screener calculates a composite Value Score from fundamental metrics drawn directly from SEC EDGAR filings and market feeds. Filters cover P/E, P/B, PEG, P/S, ROE, gross margin, debt to equity, current ratio, and dividend yield, and the site groups results by sector and industry for targeted review. Predefined screens include Graham number filters, high Piotroski F scores, below book value, and high dividend presets.
Key Differentiator
The defining trait is a scoring model built exclusively on official filings and market data, not on forecasts or scraped signals. That focus makes the methodology highly traceable because every input links back to a filing or a quoted market datapoint. The approach favors clarity for investors who want to verify every component of a valuation signal.
Pros
The scoring method is transparent and auditable since inputs come from official filings and market feeds, which helps you confirm the basis for any pick. The filtering set is deep enough for value investors who screen across classic metrics like P/E, P/B, and Piotroski F score while also testing liquidity and leverage ratios. Sector and industry breakdowns make it faster to narrow searches to specific pockets of value, and the predefined screens get you from idea to shortlist without building screens from scratch.
Cons
-
Requires a working knowledge of valuation metrics and investment principles to interpret scores correctly.
-
Covers only US equities and fundamental data, so it does not provide technical indicators or real time news.
-
Several advanced filters and full access to the entire stock list are behind a paid subscription.
When It May Not Fit
If you trade on intraday technicals or rely on real time news alerts, this tool will feel incomplete because it focuses on filings and market data. Active traders who need charting, momentum signals, or social sentiment will need a different solution. Investors seeking non US coverage should look elsewhere because the dataset is US equity centric.
Who It’s For
Individual investors and analysts who practice value investing will get the most from StockPik since it emphasizes verified financial statements and classic valuation ratios. Portfolio managers wanting a repeatable, filing based screening workflow will also find it useful. It matches readers who prioritize traceability over predictive modeling.
Real World Use Case
A value investor scans the technology sector for names trading below book value and with a high Piotroski F score. The investor applies the predefined screens, reviews the top Value Score results, and verifies each pick by opening the linked SEC filing that supplies the underlying metric. The shortlist then moves to deeper fundamental due diligence.
Website: https://stockpik.co
Comparison of alternatives
Among valuation platforms for retail investors, the balance between in-depth features and accessibility defines each platform’s standout characteristic.
Feature depth and coverage area
TIKR’s advantage lies in its expansive coverage of over 100,000 stocks across 92 countries and its long historical data series. This breadth is by its competitors, making it a strong choice for investors prioritizing international exposure and data extensiveness. On the other hand, Tickerplace provides financial tools including intrinsic value calculators and multi-model analysis with complete transparency, unique in comparison to other platforms which might not freely disclose calculation frameworks.
User interfaces and transparency
FinMav.ai’s natural language processing for query creation makes stock screening intuitive and accessible to less technical users. Moreover, its built-in reasoning for filter applications serves as a significant draw for those seeking logical transparency during stock selection. Meanwhile, StockPik’s reliance exclusively on verifiable SEC filings solidifies the credibility of its derived value scores, catering particularly to investors wary of third-party aggregations.
Best fit
-
Long-term, valuation-focused investors needing daily transparent intrinsic value estimations without hidden costs should select Tickerplace.
-
Retail investors seeking global stock coverage and extended historical data will find TIKR most advantageous.
-
Analysts wishing to align with SEC documentation methodologies favor StockPik for producing traceable, reliable scores.
-
Investors preferring preset criteria with natural language clarity should consider FinMav.ai for its straightforward queries and intuitive screener.
Our pick
For retail investors aiming to proactively assess and validate their investment choices using valuation frameworks, Tickerplace excels in its offerings. Its integration of multi-model valuation outputs with transparent financial analysis—as well as free basic tools—presents a standout solution. For those focusing on different goals such as global data scope, TIKR might serve as a suitable alternative.
Tickerplace serves as a comprehensive platform for stock valuation by integrating multi-model methodologies and fostering transparent analysis processes.
| Platform | Key Differentiator | Coverage | Pricing | Limitation |
|---|---|---|---|---|
| Tickerplace | Multi-model valuation transparency | 10,000+ US and AUS stocks | Free/Premium at $8/mo | Advanced data restricted to premium tier |
| TIKR | Global financial statements and analyst estimates | 100,000+ stocks globally | Free/Plans at $17.95/mo | Depth gaps in premium datasets and potential small market coverage gaps |
| FinMav.ai | Natural language screening with reasoning explanations | 3,000+ US stocks | Free/Pro at $19/mo | Limited to US-listed equities |
| Ideaft | Framework-based intrinsic value scoring | 2,900+ US stocks | Free/Pro at $15/mo | Exclusive focus on fundamental analysis |
| StockPik | Verified filing-based Value Score | 6,000+ US stocks | Price not published | No international market data |
How to Identify the 10 Best Undervalued Stocks to Buy Now Using Reliable Valuation Tools
Finding the best undervalued stocks requires precise, transparent valuation methods that go beyond surface-level price alerts. Many investors struggle to confirm whether a stock is truly undervalued or simply priced lower for underlying risks. Tickerplace offers a multi-model valuation platform built for long-term investors who want clarity on intrinsic value estimates and margin of safety calculations. This tool filters through 10,000+ US and Australian stocks with daily updates to provide reliable fair value targets based on DCF, P/E, and P/S ratios.

For individual investors focused on long-term value, Tickerplace delivers detailed side-by-side company comparisons, sector analytics, and valuation calculators to verify the best undervalued stocks to buy now. Access free valuation tools or upgrade for deeper historical data to support your critical investment decisions with confidence and precision.
FAQ
What features make Tickerplace suitable for long-term investors?
Tickerplace offers daily multi-model valuation outputs that generate intrinsic value estimates by combining DCF math with ratio-based checks. This capability allows long-term investors to understand the valuation dynamics of stocks clearly. Users can effectively assess potential investments using structured analysis and transparent methodologies.
How does Tickerplace’s stock screener compare to TIKR’s?
TIKR’s interface organizes detailed financials and forecasts, making it quick to move from ratio screening to model inputs. Tickerplace, on the other hand, targets individual investors focused on intrinsic value by providing 60+ fundamental and technical filters in its stock screener. While TIKR excels in accessing global financial statements, Tickerplace specializes in transparent multi-leg valuations tailored to long-term strategies.
What pricing options does Tickerplace offer?
Tickerplace provides a free basic plan that allows access to core valuation tools alongside premium subscription options for deeper insights. The premium plan starts at $8/month, offering expanded features for serious investors looking for detailed analyses and advanced functionalities beyond the free tier.
Can I track watchlists with Tickerplace?
Yes, Tickerplace allows users to save filter configurations and stock baskets, making it easy to monitor selected stocks over time. This feature is especially valuable for investors wanting to track fair value changes and set up alerts for their preferred stocks.
What type of investors would benefit from using Tickerplace?
Individual investors focused on long-term value and those interested in data-driven analysis without sentiment signals will find Tickerplace particularly beneficial. It caters to both beginners wanting to learn about valuation concepts and experienced investors looking to run quick multi-model checks.