

TL;DR:
- Combining fundamental and technical analysis provides a comprehensive approach to evaluating stocks and timing investments.
- Beginners should start by analyzing financial statements and key ratios before confirming entry points with chart indicators and support levels.
Stock price analysis is the process of evaluating a stock's value and market timing using fundamental and technical methods. Most beginners treat these two disciplines as separate, but the most effective approach combines them into a single, repeatable framework. Fundamental analysis answers what to buy; technical analysis answers when to buy. This stock price analysis tutorial walks you through both methods, the key indicators you need, and a practical process for assessing any stock before you commit capital.
What is stock price analysis, and why does it matter?
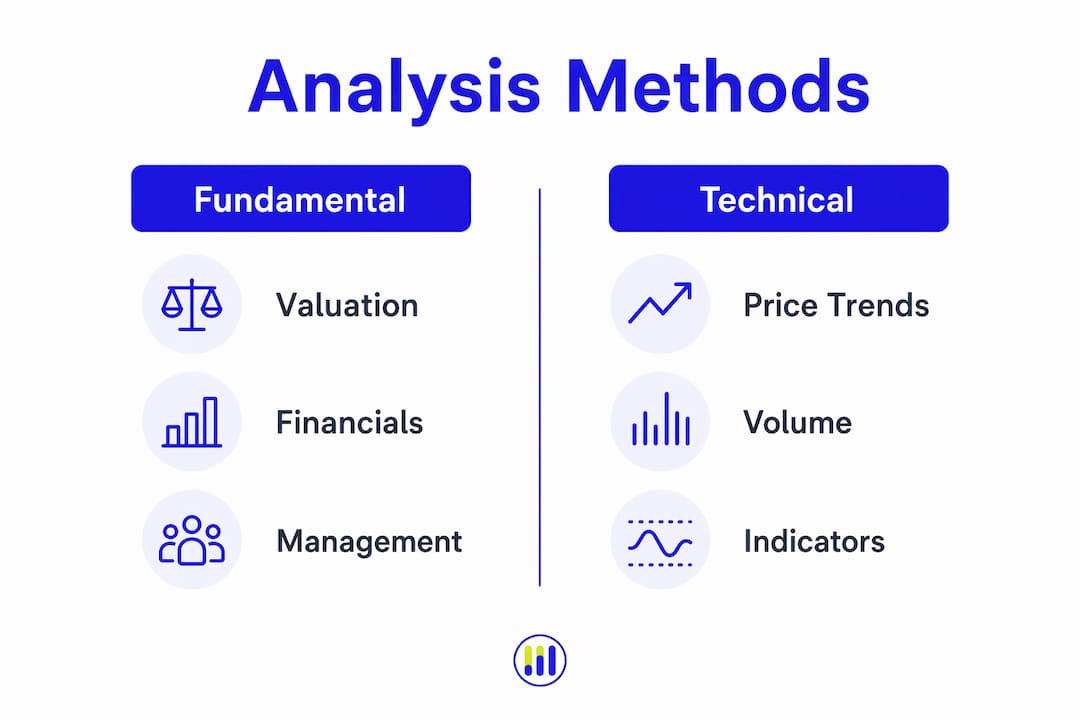
Stock price analysis is the formal practice of examining a company's financial health and its stock's price behavior to determine whether the stock is fairly valued. The industry uses two recognized disciplines: fundamental analysis and technical analysis. Fundamental analysis evaluates earnings, revenue, cash flow, and financial ratios to estimate a company's intrinsic value. Technical analysis reads price charts, volume, and momentum indicators to identify trends and optimal entry points. Used together, these methods give you a complete picture of both business quality and market timing.
Key fundamental analysis techniques for beginners
Fundamental analysis starts with three financial statements: the income statement, the balance sheet, and the cash flow statement. The income statement shows revenue and earnings. The balance sheet reveals assets, liabilities, and equity. The cash flow statement confirms whether a company actually generates cash, not just accounting profit.
From those statements, three ratios do most of the heavy lifting:
- Price-to-earnings (P/E) ratio: Compares the stock price to earnings per share. A high P/E may signal overvaluation; a low P/E may indicate a bargain or a struggling business.
- Return on equity (ROE): Measures how efficiently management generates profit from shareholder capital. Higher ROE generally signals a stronger business.
- Debt-to-equity ratio: Shows how much debt a company carries relative to equity. Financial ratios like P/E, ROE, and debt-to-equity are the core metrics for assessing stock value and company health.
Beyond the numbers, qualitative factors matter too. A company's competitive advantage, the quality of its management team, and its position within its industry all affect long-term value. A stock with strong financials but weak leadership or a shrinking market can still disappoint.
Pro Tip: When screening stocks, filter first by ROE above 15% and a debt-to-equity ratio below 1.0. This narrows your list to financially sound businesses before you spend time on deeper research.
What technical indicators should beginners use?
Technical analysis interprets price and volume data to identify trends, momentum, and potential turning points. The four most widely used indicators are moving averages, the Relative Strength Index (RSI), MACD, and Bollinger Bands. Moving averages, RSI, MACD, and Bollinger Bands each serve a distinct purpose in trend and momentum analysis.

| Indicator | What it measures | Typical use |
|---|---|---|
| 50-day moving average | Short-term trend direction | Identifies near-term momentum |
| 200-day moving average | Long-term trend direction | Confirms bull or bear trend |
| RSI | Momentum extremes | Flags overbought or oversold conditions |
| MACD | Trend direction and crossovers | Confirms trend changes |
| Bollinger Bands | Price volatility range | Spots breakouts and contractions |
The RSI deserves special attention for beginners. RSI above 70 signals overbought conditions, while RSI below 30 signals oversold conditions. A reading above 70 does not guarantee a price drop, but it does warn that a pullback is more likely. You can read a deeper breakdown of RSI in stock analysis to understand how to apply it alongside other indicators.
Support and resistance levels are equally critical. Technical analysis interprets supply and demand dynamics through these price floors and ceilings, where buying and selling pressures balance. A stock that repeatedly bounces off $50 has strong support there. A stock that stalls at $80 faces resistance. These levels help you set realistic entry and exit targets.
Pro Tip: Never act on a single indicator. Confirm a signal with at least two independent tools. For example, an RSI below 30 combined with a price bounce off a known support level is a far stronger buy signal than either reading alone.
How to combine fundamental and technical analysis
Fundamental analysis establishes intrinsic value; technical analysis filters timing for optimal entry and exit. Relying on only one method creates blind spots. A fundamentally strong stock can still fall 30% if you buy at the wrong time. A technically attractive chart pattern means little if the underlying business is deteriorating.
A four-step process integrates both disciplines effectively:
- Screen fundamentally. Use P/E, ROE, and debt-to-equity to build a shortlist of quality companies. Eliminate businesses with weak earnings or excessive debt.
- Analyze deeply. Read the financial statements, assess competitive position, and estimate intrinsic value using a discounted cash flow (DCF) model or P/E-based valuation.
- Time with technicals. Check the 50-day and 200-day moving averages, RSI, and support levels. Wait for a technically favorable entry, such as a pullback to support with RSI below 50.
- Manage risk. Set a stop-loss and define your position size before you buy.
| Method | Answers | Best for |
|---|---|---|
| Fundamental analysis | What to buy | Stock selection and valuation |
| Technical analysis | When to buy | Entry and exit timing |
| Combined approach | What and when | Full investment decision |
Combining both disciplines can improve risk-adjusted returns meaningfully. The reason is straightforward: fundamentals protect you from buying poor businesses, and technicals protect you from buying good businesses at the wrong price.
Practical steps for conducting your own stock analysis
Applying these methods to a real stock follows a clear sequence. Here is a repeatable process you can use on any equity:
- Pick a stock and pull its financials. Access the income statement, balance sheet, and cash flow statement. Calculate P/E, ROE, and debt-to-equity.
- Estimate intrinsic value. Use a DCF model or a P/E-based target price. Compare that estimate to the current market price to assess the margin of safety.
- Open the price chart. Plot the 50-day and 200-day moving averages. Note where the stock sits relative to both.
- Check RSI and MACD. Confirm whether momentum supports or contradicts your fundamental view.
- Identify support and resistance. Mark key price levels and plan your entry accordingly.
- Set your risk parameters. Stop-loss orders placed 7–10% below entry limit downside on any single trade. Risk no more than 1–2% of your total portfolio on one position.
Common beginner mistakes include overrelying on a single indicator, ignoring volume, and skipping risk management entirely. Volume confirms price moves: high volume validates a breakout, while low volume suggests weak conviction behind a price move. Always check volume before acting on a chart signal.
- Avoid chasing stocks after a large price spike. Wait for a pullback.
- Do not ignore the broader market trend. Individual stocks rarely sustain uptrends in a falling market.
- Review your analysis regularly. Fundamentals change with each earnings report.
Pro Tip: Build a one-page stock summary for every position you research. Include the intrinsic value estimate, key ratios, technical levels, and your stop-loss price. This forces discipline and gives you a reference point when emotions run high.
Key Takeaways
Effective stock price analysis requires combining fundamental valuation with technical timing to make informed, disciplined investment decisions.
| Point | Details |
|---|---|
| Start with fundamentals | Use P/E, ROE, and debt-to-equity to identify quality companies before analyzing charts. |
| Layer in technicals | Apply moving averages, RSI, and support levels to time your entry after fundamentals confirm quality. |
| Combine both methods | Integrating fundamental and technical analysis addresses both stock selection and trade timing. |
| Manage risk always | Set stop-loss orders 7–10% below entry and limit each trade to 1–2% of your portfolio. |
| Confirm with volume | High volume validates price moves; low volume signals weak momentum and warrants caution. |
Tickerplace's take on mastering stock analysis
The most common mistake new investors make is treating analysis as a one-time event rather than a continuous process. A stock that looks undervalued today may not look that way after the next earnings report. The framework matters less than the discipline of applying it consistently.
At Tickerplace, we see investors get into trouble when they skip the fundamental layer entirely and trade on chart patterns alone. A technically attractive setup on a company with deteriorating earnings is a trap, not an opportunity. Successful analysis layers technical indicators only after fundamentals confirm business quality. That sequence protects you from buying momentum in a fundamentally weak stock.
Patience is the underrated skill in stock analysis. The best entry points rarely arrive the moment you finish your research. Waiting for both a fundamental margin of safety and a technically favorable setup takes discipline. Investors who build that habit consistently outperform those who act on incomplete signals.
— Tickerplace
Put your analysis into practice with Tickerplace
Tickerplace gives individual investors the tools to apply everything covered in this guide without a Bloomberg terminal or a finance degree.

The stock valuation calculator estimates intrinsic value using DCF, P/E, and P/S models, updated daily across 10,000+ US and ASX-listed equities. The intrinsic value calculator lets you input your own assumptions and generate a fair value target in minutes. Both tools complement the manual analysis steps outlined above, giving you a second opinion grounded in institutional-grade methodology. Tickerplace is free to use, and no subscription is required to get started.
FAQ
What is stock price analysis?
Stock price analysis is the process of evaluating a stock's value and price behavior using fundamental and technical methods to determine whether it is overvalued, undervalued, or fairly priced.
What is the difference between fundamental and technical analysis?
Fundamental analysis evaluates financial statements and ratios to estimate intrinsic value; technical analysis reads price charts and indicators like RSI and moving averages to identify optimal entry and exit timing.
What RSI level signals a buying opportunity?
An RSI reading below 30 indicates oversold conditions, which can signal a potential buying opportunity, particularly when confirmed by a price bounce off a known support level.
How do I manage risk when analyzing stocks?
Set a stop-loss order 7–10% below your entry price and limit each position to 1–2% of your total portfolio to control downside on any single trade.
Can beginners use both fundamental and technical analysis?
Yes. Starting with basic ratios like P/E and ROE to screen stocks, then using moving averages and RSI to time entries, gives beginners a structured and repeatable stock analysis process.