

Commonwealth Bank of Australia (ASX: CBA) was trading at approximately A$173.04, down 0.51% intraday, based on a Google Finance snapshot timestamped August 12 at 11:22 AM AEST (GMT+10). At that level, CBA sits well within its 52-week range of A$146.98 to A$185.59, closer to the upper half, which places it in fair-to-premium territory relative to its own recent history. For most long-term investors, the share price commbank reflects a blue-chip bank trading at a premium multiple, not a deep-value entry point, but one that continues to reward patient holders through fully franked dividends.
- Ticker: CBA (ordinary shares on the ASX)
- Exchange: Australian Securities Exchange (ASX)
- Price source: Google Finance (CBA:ASX), timestamped August 12, 11:22 AM AEST
- 52-week range: A$146.98 to A$185.59
Key Takeaways
| Point | Details |
|---|---|
| Live price reference | CBA traded at approximately A$173.04 (-0.51%) in the sample snapshot; confirm current price before acting. |
| Valuation signal | Forward yield of 2.85% and upper-half 52-week positioning suggest fair-to-premium pricing, not a discount entry. |
| Dividend timing | Ex-dividend date is February 18, 2026; buy before that date to qualify for the A$4.95 fully franked dividend. |
| Top risks to watch | NIM compression, rising credit losses, and APRA capital requirement changes are the three key downside drivers. |
| Tickerplace tools | Use the free intrinsic value calculator and CBA company page to run your own DCF and valuation check before buying. |
This article is general information, not a substitute for advice from a qualified financial advisor. Consult a qualified financial professional about your own circumstances before acting on anything here.
What are the key metrics for CBA shares at a glance?
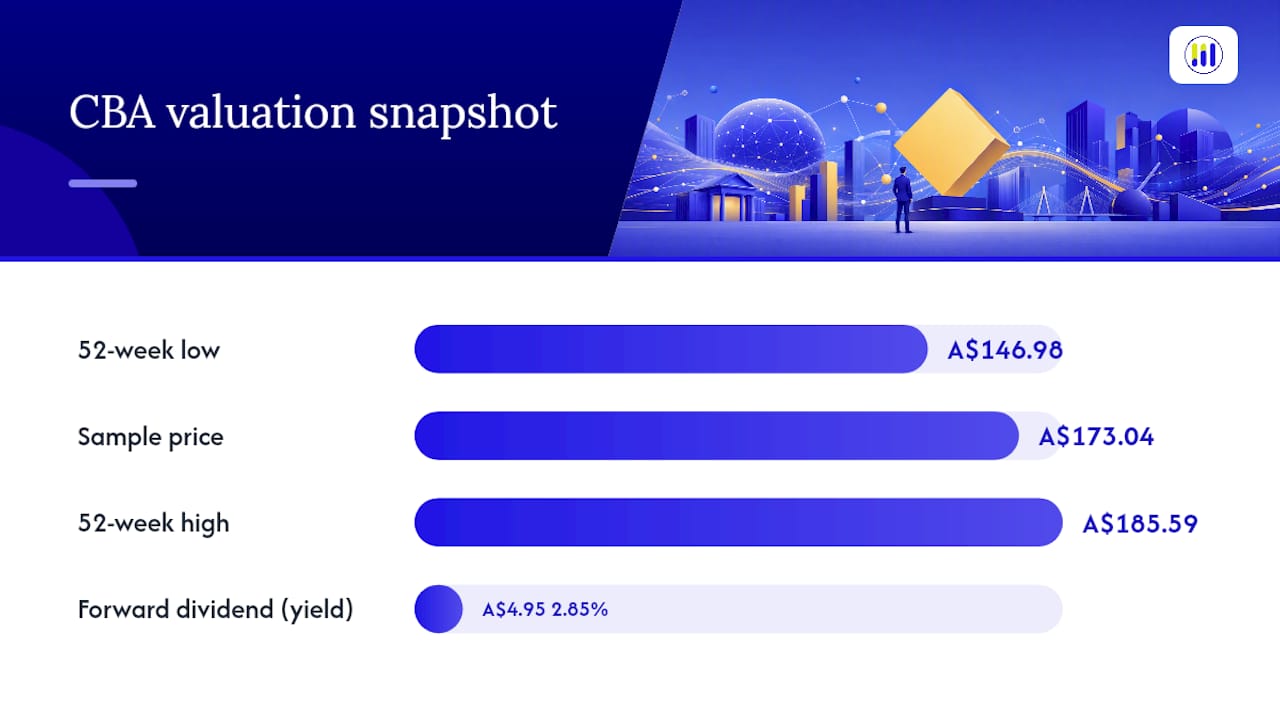
The table below draws from Yahoo Finance (CBA.AX) and the ASX company page for CBA. All figures reflect the sample snapshot period; confirm current data before trading.
| Metric | Value |
|---|---|
| Ticker | CBA (ASX) |
| Sample price | A$173.04 |
| Day change | -0.51% |
| 52-week range | A$146.98–A$185.59 |
| Forward dividend & yield | A$4.95 (2.85%) |
| Ex-dividend date | February 18, 2026 |
- Pricing note: Most retail platforms, including Google Finance and Yahoo Finance, display data with a 20-minute delay. CommSec and the CommBank investor share-price page may show near-live data for account holders.
- PERLS distinction: CBA ordinary shares trade under ticker CBA. CommBank also lists PERLS preference securities (PERLS XII–XVI) on the ASX under separate tickers; these carry different risk, yield, and price profiles and are not the same instrument.
- Data cut-off: All snapshot figures are from the August 12 sample. Treat them as illustrative context, not a live feed.
Why does the CBA share price move?
CBA is one of Australia's "Big Four" banks, so its price responds to a specific set of macro and company-level signals. Understanding these drivers helps you separate short-term noise from meaningful shifts.
- Net interest margin (NIM): The spread between what CBA earns on loans and pays on deposits is the single largest driver of earnings. When the Reserve Bank of Australia (RBA) raises rates, NIM can expand initially, but deposit repricing and competition often compress it over subsequent quarters.
- Credit quality and loan growth: Rising mortgage arrears or business loan defaults directly pressure provisions and earnings. Conversely, strong housing credit growth expands the loan book and supports revenue.
- RBA rate decisions: A rate cut cycle tends to compress NIM but can lift asset prices and reduce credit stress simultaneously, creating a mixed signal for bank stocks.
- Regulatory and capital requirements: APRA capital ratio requirements and any changes to lending standards affect how much capital CBA must hold, which in turn constrains dividends and buybacks.
- Dividends and buybacks: CBA's semi-annual dividend and any announced on-market buybacks are direct price catalysts around announcement dates.
- Market sentiment and analyst revisions: Consensus target-price upgrades or downgrades from major brokers can move CBA's price materially in a single session, as intraday sentiment swings on ASX-listed stocks demonstrate.
Pro Tip: When CBA releases half-year or full-year results, focus on NIM guidance and the provision charge rather than the headline profit figure. A record profit paired with rising provisions and NIM compression is a warning sign that the market often prices in before the next reporting period.
How has CBA's share price performed historically?

CBA's 52-week range of A$146.98 to A$185.59 shows that the stock has experienced a substantial price range within the year, which is meaningful for a large-cap bank. The lower bound represents periods of rate-cycle uncertainty or credit-quality concern; the upper bound reflects peak optimism about NIM and dividend sustainability.
For multi-period context, the Tickerplace CBA company page and the ASX company page both provide chart views and historical data. When reading CBA charts, three principles apply:
- Use dividend-adjusted charts for total-return comparisons. CBA pays substantial semi-annual dividends; a price-only chart understates actual investor returns significantly over five-year periods.
- Log scale for long-term trend analysis. A logarithmic price axis shows percentage moves proportionally, which matters when comparing CBA's performance across different price levels over a decade.
- Volume confirms breakouts. A price move through a prior high or low on below-average volume is less reliable than one accompanied by elevated turnover.
Google Finance and Yahoo Finance both offer adjustable chart periods and dividend-adjusted views. For a structured historical and valuation overlay in one place, the Tickerplace CBA page combines price history with intrinsic-value estimates.
Is it a good time to buy CBA shares?

At approximately A$173, CBA is not trading at a discount by conventional metrics.
CBA has consistently commanded a premium to peers given its superior return on equity and franchise strength. If CBA is trading at the upper end of that band, the implied growth expectation embedded in the price is elevated, and a disappointment in NIM or credit quality could reprice it toward the midpoint quickly.
For a DCF intuition: the key sensitivity is the discount rate versus the assumed long-run earnings growth rate. At A$173, a small change in either assumption shifts the implied fair value by A$10 to A$20 per share. That sensitivity is precisely why a tool like Tickerplace's intrinsic value calculator is useful: you can run your own assumptions rather than accepting a single consensus number.
Methodology note: sector ranges are indicative of historical Australian bank trading multiples. Individual circumstances and tax treatment affect actual return outcomes. This is not financial advice.
Pro Tip: Use the Tickerplace stock valuation checker to run a live overvalued/undervalued flag on CBA before committing capital. Pair it with the margin-of-safety calculator to set a target entry price below your estimated intrinsic value.
How do you buy CBA shares in Australia?
Buying CBA on the ASX is straightforward for Australian residents. The process follows these steps:
- Choose a broker. CommSec is the most widely used retail platform in Australia and provides near-live ASX pricing for account holders. Other broker types include full-service advisors, discount online brokers, and micro-investing apps.
- Open and fund your account. Complete identity verification (AML/KYC), link a bank account, and deposit funds in AUD.
- Search the ASX ticker. Enter "CBA" and confirm you are viewing Commonwealth Bank of Australia ordinary shares, not a PERLS instrument.
- Place your order. A market order executes at the best available price immediately during ASX trading hours (10:00 AM to 4:00 PM AEST, Monday to Friday). A limit order lets you specify a maximum buy price.
- Choose CHESS or issuer-sponsored. CHESS-sponsored holdings give you a Holder Identification Number (HIN) and keep shares registered in your name through the ASX's clearing system. Issuer-sponsored holdings use a Securityholder Reference Number (SRN) registered directly with CommBank's share registry. Both are legitimate; CHESS is generally preferred for active traders.
- Settlement and records. ASX equity trades settle on a T+2 basis (two business days after the trade date). Keep contract notes for capital gains tax records.
Practical cautions:
- Overseas investors should confirm their jurisdiction's rules on holding Australian equities and any withholding tax implications on franked dividends.
- Non-AUD funding incurs foreign exchange conversion costs; factor these into your effective buy price.
- Do not trade outside ASX hours expecting execution; pre-market and after-hours orders queue for the next open.
What dividends does CBA pay, and how does franking work?
CBA pays dividends on a semi-annual schedule, typically an interim dividend (announced with half-year results, usually February) and a final dividend (announced with full-year results, usually August). Based on Yahoo Finance data, the forward dividend is A$4.95 per share, representing a yield of approximately 2.85% at the sample price, with an ex-dividend date of February 18, 2026.

Australian resident investors receive a franking credit alongside the cash dividend, which offsets their personal income tax liability. For a taxpayer in a lower marginal bracket, excess franking credits can generate a tax refund. Non-resident investors generally cannot use franking credits, which reduces the effective yield for offshore holders.
Risks to the dividend include a sharp rise in credit losses, a regulatory capital requirement increase from APRA, or a sustained NIM compression that reduces underlying cash earnings.
Where should you monitor CBA's price and set alerts?
Reliable monitoring requires knowing which sources are live versus delayed, and combining price alerts with news triggers.
- ASX company page (CBA): Official market data, company announcements, and regulatory disclosures. Authoritative for market-cap figures and ASX-released news.
- CommBank investor relations: Issuer-stated share price, PERLS distinctions, and dividend announcements directly from the company.
- Google Finance (CBA:ASX): Intraday chart with timestamp; 20-minute delay for non-account holders. Useful for quick checks.
- Yahoo Finance (CBA.AX): Consolidated metrics including P/E, EPS, forward dividend, and ex-dividend date in one view.
- CBOE Australia: Market data and derivatives/ETP context for ASX-listed products; relevant if you are tracking options or structured products over CBA.
- Tickerplace (CBA company page): Valuation overlay alongside price data; useful for long-term investors who want intrinsic-value context next to the live chart.
- Mobile alerts: Apps such as those listed in the Tickerplace stock market app guide can push price-threshold and news notifications to your phone.
Pro Tip: Set two alert types simultaneously: a price-threshold alert (e.g., CBA drops below A$160 or rises above A$185) and a company-announcement alert via the ASX. Price alone can be misleading; a sharp move accompanied by an ASX announcement requires a different response than one driven purely by index rebalancing.
Reading CBA as a long-term investor
CBA suits both yield-focused and total-return investors, but the entry price determines which outcome you actually get.
The three most important long-term risks are credit cycle deterioration (rising mortgage arrears as fixed-rate loans reprice), sustained NIM compression from deposit competition and rate cuts, and regulatory capital increases from APRA that constrain capital returns. Against those, CBA's three structural strengths are its scale and market share in Australian retail banking, a diversified business spanning wealth, insurance, and institutional banking, and franchise margins that consistently exceed those of smaller domestic peers.
The discipline that matters most is buying with a margin of safety relative to your own intrinsic-value estimate, not relative to where the price was six months ago. Headlines about record profits or analyst upgrades are not a valuation framework.
Tickerplace gives you a live valuation check on CBA
Knowing the share price commbank is only half the picture. The more useful question is whether that price reflects fair value, and that requires a model, not just a quote. Tickerplace provides free, institutional-grade DCF, P/E, and P/S valuation tools for ASX-listed stocks including CBA, updated daily, without a brokerage account or subscription required.

Run a sensitivity scenario on CBA's intrinsic value using the Tickerplace intrinsic value calculator: adjust the discount rate and growth assumptions to see how much the fair-value estimate moves. If you are averaging into a position over time, the stock average price calculator tracks your cost basis automatically. Pro subscribers unlock full DCF breakdowns, scenario analysis, and advanced screeners. Start with the free tools on the Tickerplace CBA company page and upgrade when the depth of analysis justifies it.
Sources
- Commonwealth Bank of Australia (CBA) Stock Price & News - Google Finance
- Share price - CommBank
- commonwealth bank of australia. cba
- Cboe
FAQ
Why are CBA shares dropping?
Short-term CBA price falls typically reflect RBA rate-cut expectations compressing NIM forecasts, rising mortgage arrear data, or broad ASX sell-offs driven by global risk sentiment. Check the ASX announcements page for any company-specific disclosure before assuming a macro cause.
Is it a good time to buy CBA shares right now?
Run your own DCF assumptions using the Tickerplace intrinsic value calculator before deciding.
What is CBA's next dividend?
Based on Yahoo Finance data, CBA's forward dividend is A$4.95 per share with an ex-dividend date of February 18, 2026; you must hold shares before that date to receive the payment. Confirm the exact amount and date on the CommBank investor relations page, as announced figures take precedence.
Should I sell my Commonwealth Bank shares?
Selling depends on whether CBA's current price exceeds your intrinsic-value estimate by enough to justify realizing a gain, and on your tax position relative to the next ex-dividend date. A valuation check using the Tickerplace stock valuation checker can help you compare current price to estimated fair value before making that decision.