
Start with the price to earnings ratio for profitable, established companies, and switch to the price to sales ratio when earnings are negative or the company is still in an early growth phase. Neither ratio works alone: P/E tells you what the market pays for a dollar of profit, while P/S tells you what it pays for a dollar of revenue. The rest of this guide shows you exactly how to calculate both, when each one breaks down, and how to run the numbers yourself.
TL;DR:
- P/E ratios are useful only for profitable, stable companies, while P/S ratios are better suited for early-stage or unprofitable firms.
- Negative earnings make P/E meaningless, so growth investors should rely on P/S and revenue growth trends instead.
- Comparing P/E and P/S with sector medians and analyzing profit margins helps avoid value traps and mispricing.
- The implied profit margin calculated from dividing P/S by P/E offers a quick sanity check for ratio consistency.
- Both ratios can be distorted by accounting practices, debt, or share buybacks, so comprehensive analysis of margins, cash flow, and debt is necessary.
PE vs PS: What Each Ratio Actually Measures
The price to earnings ratio, or P/E, divides a company's share price by its earnings per share (EPS). The formula looks like this: P/E = Price per Share ÷ EPS. Analysts typically split it into two versions: trailing P/E, which uses the last twelve months of actual earnings, and forward P/E, which uses analyst projections for the year ahead. Trailing P/E reflects what already happened; forward P/E reflects what the market expects to happen, and the gap between the two often signals whether a stock is priced for a slowdown or a rebound.
The price to sales ratio, or P/S, divides market capitalization by total revenue, or price per share by revenue per share: P/S = Market Cap ÷ Total Sales (TTM). Because revenue recognition rules are stricter than earnings rules, P/S resists the kind of accounting manipulation that can distort net income through one-time charges, tax adjustments, or aggressive cost capitalization.
Each ratio carries its own strengths and blind spots:
- P/E pros: ties valuation directly to profit, widely tracked across every sector, easy to benchmark against historical averages.
- P/E cons: meaningless for unprofitable companies, sensitive to accounting noise and one-off items.
- P/S pros: works even when a company loses money, harder to manipulate than earnings, useful for comparing growth-stage firms.
- P/S cons: ignores margins entirely and says nothing about debt load or actual profitability.
Statistic to remember: when a company reports negative earnings, its P/E ratio becomes negative or undefined and simply cannot be used for comparison. That single fact is why growth investors reach for P/S first and worry about P/E later.
When Should You Use P/E vs P/S?
The choice usually comes down to one question: does the company make money yet? A few rules of thumb make the decision almost automatic.
- Profitable and stable? Lean on P/E. Mature businesses with consistent earnings, like large retailers or utilities, are easiest to judge against historical P/E ranges.
- Unprofitable, early-stage, or hypergrowth? Lean on P/S. A young SaaS or biotech company can post negative earnings for years while revenue climbs sharply, making P/E useless and P/S the only workable gauge.
- Turnaround or cyclical business? Check both. Cyclical companies (airlines, miners, homebuilders) often show distorted P/E figures at the top or bottom of a cycle, so pairing it with P/S, or normalizing earnings across the cycle, gives a fuller picture.
Once you have a number, don't stop there. Run through this checklist before drawing any conclusion:
- Compare gross and net margins against sector peers, not just the company's own history.
- Check revenue and earnings growth rates over the last three to five years.
- Adjust for debt by looking at enterprise value, not just market cap.
- Ask whether share buybacks have flattered the P/E without changing the underlying business.
Pro Tip: Never judge a P/E or P/S number in isolation. Pull the sector median and the stock's own five-year range first. A P/S of 8 looks alarming for a grocery chain but ordinary for a fast-growing software company, and the same logic applies to P/E.
How to Calculate P/E and P/S: Two Worked Examples
Numbers make this concrete. Here's how the two ratios behave in practice, using two contrasting company profiles.
Example 1: A profitable, mature company. Suppose a company trades at $50 per share, reports EPS of $2.50, and generates revenue per share of $20. Its P/E is $50 ÷ $2.50, or 20x. Its P/S is $50 ÷ $20, or 2.5x. Divide P/S by P/E (2.5 ÷ 20) to get an implied net margin, meaning the market's pricing is consistent with a company that keeps about 12.5 cents of every revenue dollar as profit. If the company's actual reported net margin is close to that figure, the two ratios agree with each other, which is a good sign of internal consistency.
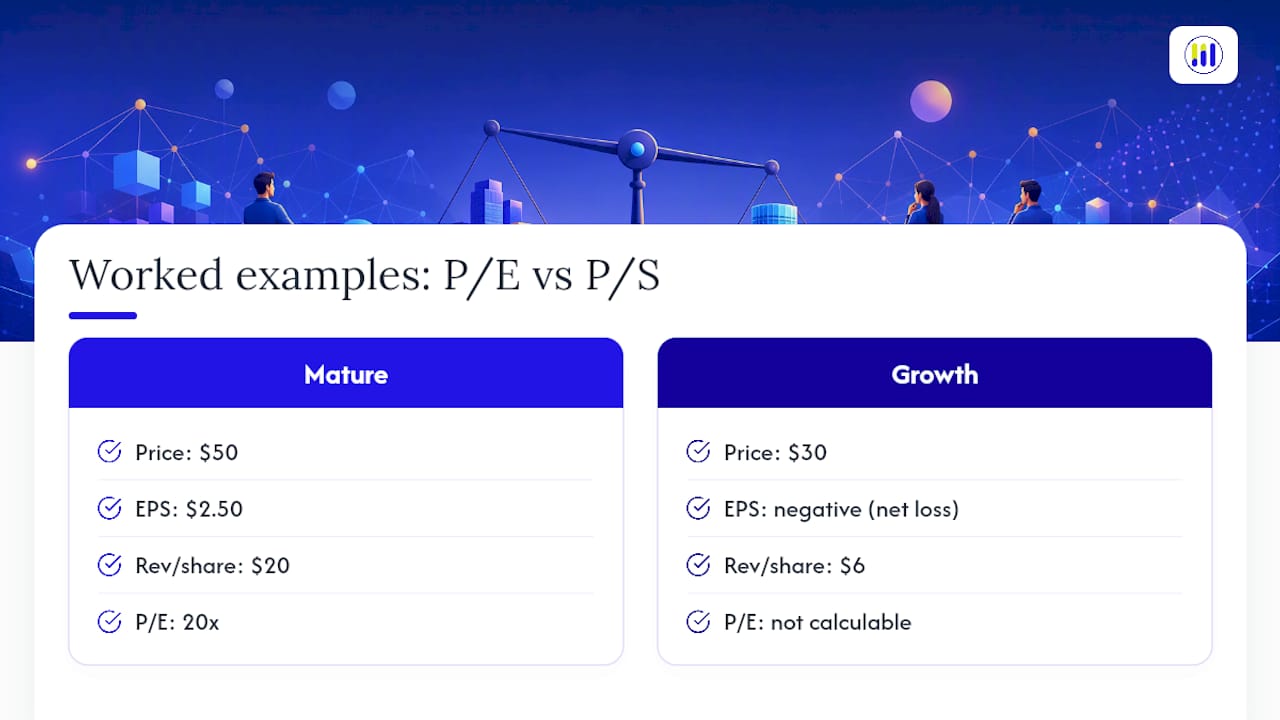
Example 2: An unprofitable growth company. Now suppose a young software company trades at $30 per share, posts a net loss (so EPS is negative and P/E is not calculable), and generates revenue per share of $6. Its P/S is $30 ÷ $6, or a moderate sales multiple. There's no P/E to compare it against, so investors rely on revenue growth rate, gross margin trends, and cash burn instead. This is precisely the scenario where P/E goes silent and P/S becomes the only useful multiple in the room.
That implied margin trick from Example 1, dividing P/S by P/E, works as a quick sanity check any time both ratios are available. If the implied margin looks wildly out of line with the company's actual reported margin, something in the story doesn't add up, either the market has mispriced the stock or one of the inputs (often trailing EPS distorted by a one-off gain or charge) needs a second look.
What P/E and P/S Miss: Value Traps and Accounting Noise
P/S ignores profitability completely. Two companies can carry an identical P/S ratio while one earns healthy margins and the other bleeds cash every quarter, because revenue says nothing about what's left after costs. P/S also ignores debt: a heavily leveraged company can look cheap on P/S alone while its enterprise value, which adds debt and subtracts cash, tells a much less flattering story. That's why EV/sales, which uses enterprise value instead of market cap, is generally the more complete alternative when comparing companies with different capital structures.
P/E has its own blind spots. One-time gains or losses, share buybacks that mechanically shrink the share count, and cyclical swings in earnings can all push P/E to numbers that don't reflect the business's underlying health.
Before trusting either ratio, run this quick checklist:
- Check the operating and net margin trend over several years, not one quarter.
- Confirm revenue growth is organic, not driven by acquisitions.
- Look at enterprise value alongside market cap to catch hidden debt.
- Ask whether recent buybacks are inflating EPS without changing the business.
Pro Tip: A stock with an unusually low P/S is not automatically a bargain. It can just as easily signal a business in structural decline, so always pressure-test a cheap-looking ratio against real margins before buying.
Running P/E and P/S Checks on Tickerplace
Reproducing the examples above takes about three steps on Tickerplace. Pull up a stock's profile, note its current P/E, P/S, and EV/sales side by side, then compare those figures against the sector median shown on the same page.
- Run the enterprise value calculator when a company carries meaningful debt.
- Check the PE ratio calculator for a fast, standalone P/E computation from price and EPS.
Record the implied margin (P/S ÷ P/E), the sector median, and a short note on debt load for each stock you review. That habit turns a one-off ratio check into a repeatable process you can trust across dozens of companies.
Our Take on Using Multiples Wisely
Ratios are diagnostics, not verdicts. A P/E of 15 or a P/S of 3 tells you where a stock sits relative to its peers, nothing more, and treating either number as a buy or sell signal on its own is how good investors talk themselves into bad decisions. The stronger habit is pairing whichever ratio fits the company with a look at gross profit margins, cash flow, and balance-sheet debt before drawing any conclusion. Build a checklist, run it the same way every time, and let the ratios flag questions rather than answer them.
— Tickerplace
Try These Ratios on Real Stocks With Tickerplace
You can access valuation tools, including P/E, P/S, EV/sales, and intrinsic value estimates, typically associated with institutional research, without the usual cost or complexity. The Free Plan lets you pull up ratios, run calculators, and build a watchlist across thousands of US and ASX-listed companies at no cost.

Start by running a stock you already follow through the stock valuation calculator to see its P/E, P/S, and intrinsic value side by side, then check its fair value against sector peers on the intrinsic value checker. If you want deeper scenario analysis, historical financials, and advanced screening beyond the free tools, Tickerplace Pro is available for $120 per year.
Sources
- Understanding the Price-to-Sales (P/S) Ratio in Stock Valuation — Investopedia
- P/S vs P/E Ratio: When Each Valuation Metric Works Best — StockTitan
- Understanding the P/E ratio — Commonwealth Bank (Brighter Investing)
This article is general information, not a substitute for advice from a qualified financial advisor. Consult a qualified financial professional about your own circumstances before acting on anything here.
FAQ
Is a P/E ratio of 30 good or bad?
It depends on the sector and growth rate. A P/E of 30 is expensive for a slow-growing utility but ordinary for a fast-growing technology company, so always compare it against the sector median rather than a fixed number.
Is 40 a good P/E ratio?
A high P/E usually signals the market expects strong future earnings growth, but it also means the stock carries more downside risk if that growth disappoints. Check the forward P/E and growth rate before deciding whether the premium is justified.
Is a lower P/S ratio always better?
No. A very low P/S can reflect a genuine bargain, or it can signal a business in decline with weak margins and no clear path to profit. Always check the company's actual margins before treating a low P/S as a buying opportunity.
Does the P/E ratio really matter?
Yes, for profitable companies it remains one of the most widely used valuation checks, but it loses meaning entirely once earnings turn negative. Pair it with P/S, margins, and debt levels rather than relying on it alone.
Can I check both P/E and P/S for a stock in one place?
Yes. Tickerplace's stock valuation calculator shows P/E, P/S, EV/sales, and intrinsic value for the same company side by side.