

TL;DR:
- A comprehensive market overview combines macroeconomic context, sector trends, and valuation methods to guide investment choices.
- Using multiple analytical approaches and maintaining disciplined synthesis improves decision accuracy and long-term outcomes.
A market overview is defined as a structured evaluation of current market conditions, sector dynamics, and stock valuations that gives investors a factual basis for decision-making. The industry term for this practice is "market analysis," and a solid market overview guide makes that analysis accessible and repeatable. Organizations using formal market analysis achieve 67% higher success rates in strategy execution. That figure reflects a simple truth: structure beats intuition when capital is at stake. This guide walks individual investors and finance professionals through the core components, data sources, valuation methods, and synthesis steps needed to build a complete picture of any market.
What are the essential components of a market overview guide?
A high-quality market analysis report rests on six pillars. A comprehensive market analysis covers market overview context, target market segmentation, competitive landscape, industry trends, market sizing using TAM/SAM/SOM frameworks, and strategic recommendations. Each pillar builds on the one before it, so skipping any one of them leaves gaps that distort your conclusions.
The six components work together as follows:
- Market overview context: Sets the macroeconomic backdrop, including GDP trends, interest rate cycles, and inflation data.
- Target market segmentation: Identifies which customer groups, geographies, or asset classes are most relevant to your analysis.
- Competitive landscape: Maps the key players, their market share, and their positioning relative to each other.
- Industry trends: Captures structural shifts such as AI infrastructure investment, regulatory changes, or demographic moves.
- Market sizing (TAM/SAM/SOM): Quantifies the total addressable market, serviceable addressable market, and serviceable obtainable market to anchor valuation assumptions.
- Strategic recommendations: Translates all prior analysis into specific, prioritized actions.
Combining multiple analytical methods such as market sizing, segmentation, and competitive analysis improves forecasting accuracy by 41%. That gain comes directly from integration, not from any single method used in isolation. Data quality and source transparency are equally critical; every methodology must be documented so findings remain traceable and repeatable.
How do you gather and analyze current market trends effectively?
Reliable data is the foundation of any industry overview summary. Government statistical releases, central bank reports, corporate earnings transcripts, and financial databases all qualify as credible secondary sources. Each source type captures a different layer of market reality, so using only one creates blind spots.
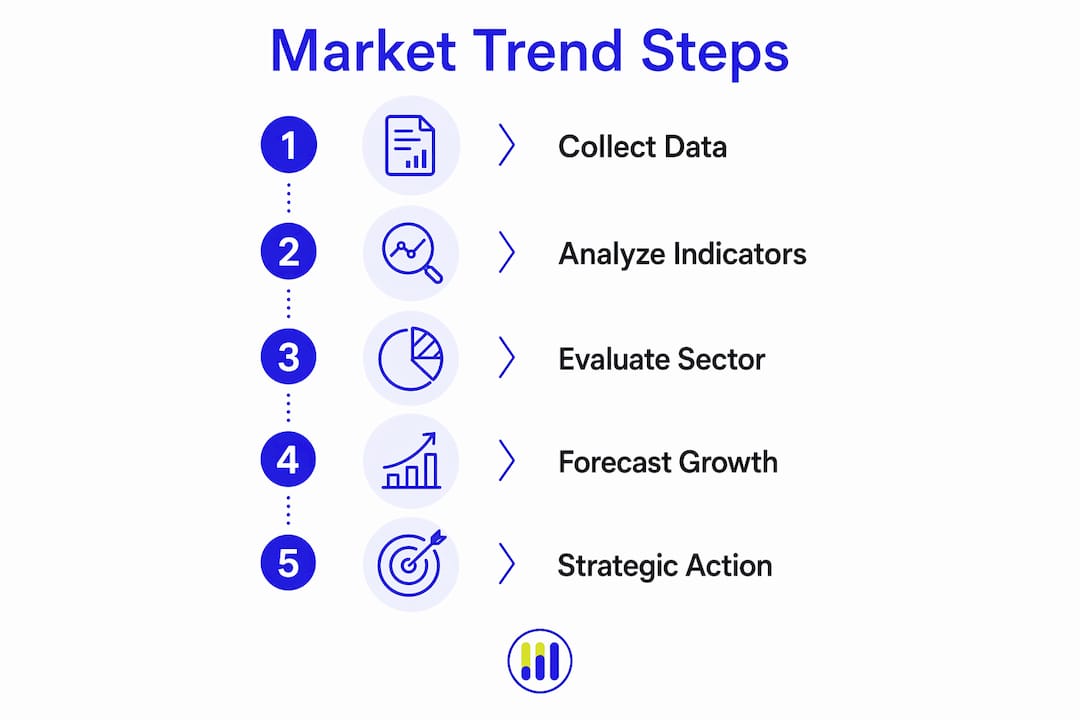
Macroeconomic indicators give you the broadest context. Inflation trends, interest rate expectations, and earnings growth rates all function as analytical inputs that shape sector performance. When the Federal Reserve signals a rate pause, for example, growth sectors typically reprice faster than defensive ones because their valuations depend more heavily on future cash flows.
Sector rotation analysis adds a second layer of precision. Q2 2026 saw equity markets rebound strongly with technology and communication services leading, fueled by AI investments, while commodity prices declined significantly. Sector rotation in 2026 favored technology and growth sectors driven by AI infrastructure build-out, while defensive sectors like Health Care showed resilience during volatility. Reading those rotations correctly tells you where institutional capital is flowing, which is a more reliable signal than any single earnings report.

Pro Tip: Differentiating market noise from meaningful trends requires a longer time horizon than typical news cycles. A 6–12 month view filters out short-term price swings and reveals the structural moves worth acting on.
When building your data collection process, prioritize these source categories:
- Government and central bank publications: Federal Reserve minutes, Bureau of Labor Statistics releases, and Treasury yield data.
- Corporate earnings transcripts: Management commentary on demand trends, cost pressures, and forward guidance.
- Financial databases: Aggregated sector performance data, valuation multiples by industry, and historical return series.
- Specialist research: Sector-specific reports from industry bodies and academic institutions.
What are practical approaches to assessing stock valuations?
Valuation sits at the center of any comprehensive market review. The goal is not to find a single "correct" price but to establish a range of fair value estimates using multiple methods, then compare that range to the current market price. Context matters as much as calculation.
Valuation methods such as price-to-earnings and intrinsic value estimation provide diverse tools, and selecting the appropriate method based on context improves decision-making. The table below outlines the most widely used approaches and when each applies best.
| Valuation method | Best application context | Key input required |
|---|---|---|
| Price-to-earnings (P/E) ratio | Mature, profitable companies with stable earnings | Trailing or forward earnings per share |
| Discounted cash flow (DCF) | Growth companies with predictable free cash flow | Revenue growth rate, discount rate |
| Price-to-sales (P/S) ratio | Early-stage or low-margin companies | Revenue per share |
| Sector-relative valuation | Comparing a stock to its industry peers | Sector median multiples |
| Intrinsic value estimation | Long-term fundamental analysis | Earnings, growth rate, margin of safety |
Contextualizing valuations within sector trends sharpens your conclusions. A technology stock trading at 30x earnings looks expensive in isolation but reasonable if the sector median is 35x and AI-driven earnings growth is accelerating. Sector-relative valuation prevents you from penalizing high-growth industries with metrics built for slower-growth ones.
Tickerplace applies DCF, P/E, and P/S models simultaneously to generate intrinsic value estimates for over 10,000 US and ASX-listed equities, updated daily. That multi-model approach mirrors the best practice described above: no single method dominates, and the range of outputs tells you more than any one number alone.
How can investors synthesize a market overview into strategic decisions?
Raw data does not become a strategy on its own. The primary value of a market overview lies in synthesizing findings into specific, prioritized recommendations. Frequent mistakes include insufficiently defined objectives and failure to translate data into actionable recommendations. Both errors produce analysis that looks thorough but drives no decisions.
A practical synthesis process follows these steps:
- Define your investment objective. Growth, income, capital preservation, or a blend. Your objective filters which findings matter most.
- Map sector trends to your portfolio. Identify which sectors your current holdings are exposed to and whether those sectors are in favor or under pressure.
- Apply valuation filters. Screen for stocks trading below their intrinsic value estimates within sectors showing positive trend momentum.
- Assess risk appetite. Balance growth sector exposure with defensive positions in areas like Health Care or consumer staples, which showed resilience in recent volatility periods.
- Document your thesis. Write down the specific conditions that would confirm or invalidate your view. This prevents emotional decision-making when prices move.
Investors who focus on long-term fundamentals and avoid short-term market noise tend to achieve better outcomes. A diversified portfolio that holds both growth and defensive sectors captures upside during expansions while limiting drawdowns during corrections. The synthesis step is where that balance gets built deliberately rather than by accident.
Pro Tip: Use the market data guide from Tickerplace to learn how to convert raw sector and valuation data into a structured investment thesis in five steps.
Key Takeaways
A structured market overview guide that integrates sector analysis, multi-model valuation, and disciplined synthesis produces more reliable investment decisions than any single analytical method applied in isolation.
| Point | Details |
|---|---|
| Six-pillar framework | A complete market analysis covers context, segmentation, competitive landscape, trends, market sizing, and recommendations. |
| Sector rotation signals | Technology and AI-driven sectors led in 2026; defensive sectors like Health Care provided stability during volatility. |
| Multi-model valuation | Using P/E, DCF, and P/S together generates a range of fair value estimates more reliable than any single metric. |
| Synthesis over data collection | Translating findings into specific, documented investment theses prevents emotional decisions and improves outcomes. |
| Source transparency | Every data point and methodology must be traceable; untraceable inputs should be treated with skepticism. |
The discipline that separates good analysis from great decisions
At Tickerplace, the most consistent pattern we observe among long-term investors is not superior data access. It is methodological discipline. Investors who document their assumptions, use multiple valuation models, and revisit their thesis against new sector data outperform those who rely on a single metric or a single news cycle.
AI-driven infrastructure investment is reshaping sector performance and earnings growth in ways that make this discipline more important, not less. When structural drivers are strong, it is tempting to abandon valuation discipline and chase momentum. That is precisely when a rigorous market overview process pays its largest dividend.
The investors who use Tickerplace most effectively treat it as a cross-check, not a shortcut. They form a view on a sector, run the valuation models, and then ask whether the numbers confirm or challenge their thesis. That back-and-forth between qualitative judgment and quantitative output is what a structured market analysis is designed to support.
— Tickerplace
Tickerplace tools that support your market analysis process
Putting a market overview into practice requires precise valuation inputs, and that is where Tickerplace delivers directly.

Tickerplace offers a free Stock Valuation Calculator that applies P/E and intrinsic value models simultaneously, giving you a multi-model fair value range for any US or ASX-listed stock. For investors focused on long-term fundamentals, the Intrinsic Value Calculator estimates what a stock is worth based on earnings, growth rate, and margin of safety inputs. Both tools are free, updated daily, and built to complement the kind of structured sector and trend analysis covered in this guide. No subscription is required to get institutional-grade valuation outputs.
FAQ
What is a market overview in investing?
A market overview is a structured summary of current market conditions, sector performance, and stock valuations that gives investors a factual basis for decisions. It typically covers macroeconomic context, sector trends, and valuation benchmarks.
What are the six components of a market analysis report?
A standard market analysis report includes market overview context, target market segmentation, competitive landscape, industry trends, market sizing using TAM/SAM/SOM, and strategic recommendations.
How do you identify meaningful market trends vs. short-term noise?
Meaningful trends require a 6–12 month view to distinguish from short-term price swings. Structural drivers like AI infrastructure investment or sustained sector rotation are more reliable signals than single-quarter earnings moves.
Which stock valuation method is most reliable?
No single method is universally superior. Using P/E, DCF, and P/S ratio models together generates a range of fair value estimates that is more reliable than any one metric applied in isolation.
How does sector rotation affect a market overview?
Sector rotation shows where institutional capital is moving, which directly affects relative valuations and risk profiles. In 2026, technology and growth sectors led while defensive sectors like Health Care provided stability during volatile periods.