

TL;DR:
- Nvidia's stock appears undervalued with a forward P/E of 19–20x and a PEG of 0.49. The current market price is below its historical and sector norms, despite strong projected growth. Geopolitical and competitive risks explain the discount, but revenue forecasts suggest long-term upside potential.
Nvidia is currently undervalued by most forward-looking valuation standards, trading at a forward P/E of 19–20x against a technology sector median of 34x and its own five-year average of 53x. That gap is not a rounding error. It represents a high-growth company priced like a mature industrial stock, which raises a direct question for individual investors and financial analysts: is NVDA undervalued or overvalued right now, and what is driving this unusual discount? The answer requires looking beyond the headline price and into the metrics that actually capture growth-adjusted value.
Is NVDA undervalued or overvalued? What P/E and PEG ratios reveal
The forward P/E ratio is the most widely used starting point for NVIDIA stock value analysis. It divides the current share price by expected earnings over the next 12 months, giving investors a forward-looking cost-per-dollar-of-profit figure. A lower number generally signals cheaper valuation relative to expected profits.
The PEG ratio, or price-to-earnings-to-growth ratio, takes this one step further. It divides the P/E ratio by the company's expected earnings growth rate, normalizing valuation for growth speed. A PEG below 1.0 is the classic signal of undervaluation relative to growth potential.
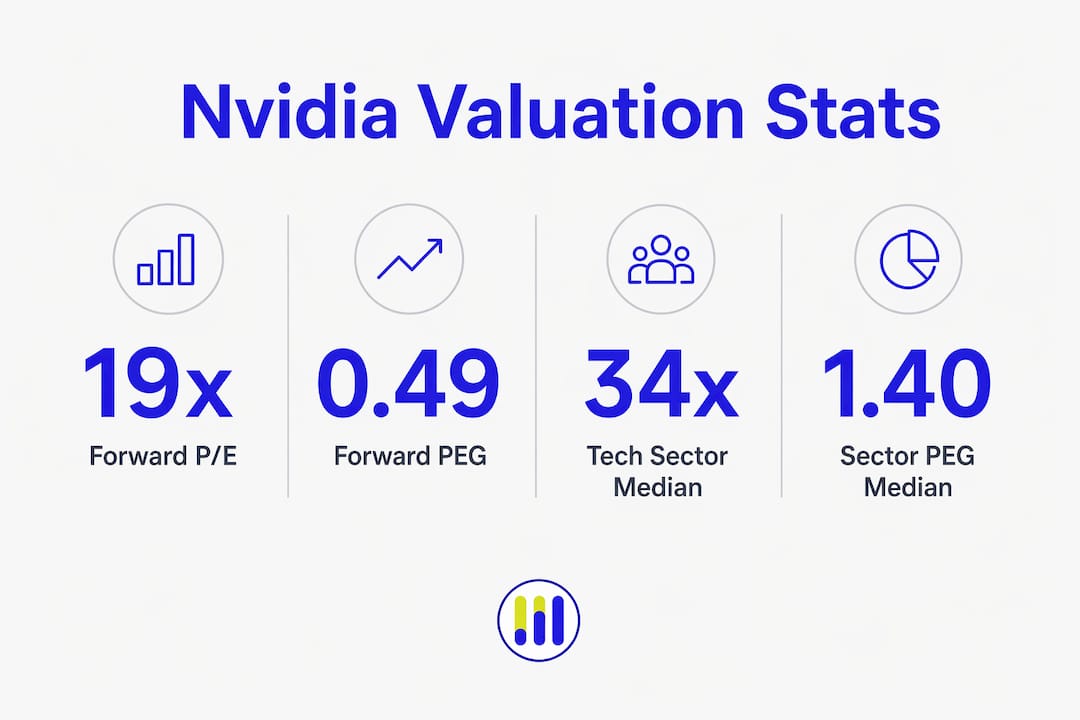
Nvidia's forward PEG sits at 0.49, compared to a sector median of 1.40 and Nvidia's own historical average of 1.47. That reading is less than half the sector norm. It means the market is pricing Nvidia's growth at a steep discount to what comparable tech companies command.
Interpreting these numbers is not always straightforward. Varying earnings forecasts and the treatment of non-recurring items can shift standard P/E calculations significantly. This is why most practitioners prioritize the forward PEG when assessing NVIDIA stock, since it accounts for growth expectations rather than just a single earnings snapshot.
Key metrics to track when assessing NVIDIA stock:
- Forward P/E ratio: Current price divided by next-12-month earnings estimates; Nvidia sits at 19–20x vs. sector median of 34x
- PEG ratio: Forward P/E divided by expected growth rate; Nvidia's 0.49 signals growth is underpriced
- Five-year average P/E: Nvidia's historical norm of 53x shows how far the current multiple has compressed
- Earnings forecast variability: Wide analyst estimate ranges reduce confidence in any single P/E reading
Pro Tip: Use Tickerplace's PEG ratio calculator to input Nvidia's current earnings estimates and growth rate yourself. Running your own numbers builds conviction that no analyst report can replicate.
How does Nvidia's valuation compare to its sector and historical averages?
The numbers become more striking when placed side by side. Nvidia's forward P/E of 19x compares to AMD's forward P/E of 59x, a peer that is still in an earlier phase of AI-related revenue growth. The market is pricing AMD's future more aggressively than Nvidia's, despite Nvidia holding the dominant position in AI accelerator chips today.

The comparison to value-focused ETFs is equally striking. Nvidia is trading at multiples below the Vanguard Value ETF (VTV), a fund designed to hold mature, slow-growth companies. Nvidia's forward growth rate of 81% makes that comparison almost paradoxical. A company growing at 81% annually is priced cheaper than a basket of dividend-paying industrials.
| Metric | Nvidia | Tech Sector Median | Nvidia 5-Year Average |
|---|---|---|---|
| Forward P/E | 19–20x | 34x | 53x |
| Forward PEG | 0.49 | 1.40 | 1.47 |
| Forward Growth Rate | 81% | Not listed | Not listed |
This table shows the scale of the discount. Nvidia's current multiples are not just below sector norms. They are below Nvidia's own historical norms by a wide margin.
Pro Tip: When reviewing low P/E stocks, always check whether the compression reflects genuine risk or market overreaction. Nvidia's case suggests the latter deserves serious consideration.
What risks and growth factors are shaping Nvidia's current valuation?
The discount exists for reasons. Markets do not misprice trillion-dollar companies by accident. Two specific risk categories are compressing Nvidia's multiple despite its growth trajectory.
The first is geopolitical exposure. China was historically responsible for up to 20% of Nvidia's data center revenue. Export restrictions have effectively removed that revenue from forward forecasts. When analysts build their models, they exclude a meaningful revenue stream, which mechanically lowers projected earnings and compresses the implied fair value.
The second risk is competitive pressure. Emerging AI chipmakers and hyperscalers developing custom silicon in-house pose a credible long-term threat to Nvidia's pricing power. If cloud providers reduce their dependence on Nvidia's GPUs, the growth trajectory narrows.
Against these risks, the growth case remains substantial:
- Analysts forecast Nvidia revenues exceeding $400 billion in 2026 and $555 billion in 2027
- AI infrastructure spending from major cloud providers shows no sign of slowing
- Nvidia's CPU product launches expand its addressable market beyond GPU accelerators
- The stock has dropped 17% from its all-time high while earnings forecasts have continued to rise, widening the valuation gap further
The net effect is a company where the bear case is visible and well-understood, while the bull case is priced as if it will not materialize. That asymmetry is what makes the NVIDIA valuation assessment so compelling right now.
How should investors practically assess Nvidia's stock value?
Assessing NVIDIA stock requires combining multiple valuation methods rather than relying on any single metric. No one ratio tells the complete story for a company at Nvidia's scale and growth rate.
A practical framework for individual investors and analysts:
- Start with forward P/E. Compare Nvidia's current 19–20x to the sector median of 34x and its own five-year average of 53x. Determine whether the discount reflects permanent impairment or temporary risk.
- Check the PEG ratio. A forward PEG of 0.49 is a strong signal that growth is underpriced. Use a stock valuation calculator to model different growth scenarios and see how fair value shifts.
- Model intrinsic value. Discounted cash flow analysis using conservative revenue growth assumptions gives you a floor estimate. This is where Nvidia's $555 billion revenue forecast for 2027 becomes a critical input.
- Size positions conservatively. Geopolitical risk and competitive uncertainty are real. Even if Nvidia is undervalued, position sizing should reflect the volatility that comes with that uncertainty.
- Monitor forward earnings revisions. If analyst estimates continue rising while the share price lags, the valuation gap widens further. That is the most reliable signal that the market is being overly cautious.
Pro Tip: Tickerplace's NVDA valuation page aggregates multi-model valuation outputs for Nvidia daily, so you can track how the fair value estimate shifts as earnings forecasts update.
Key Takeaways
Nvidia's forward PEG of 0.49 and forward P/E of 19–20x place it firmly in undervalued territory relative to its own history, its sector peers, and even value-focused ETFs, despite an 81% forward growth rate.
| Point | Details |
|---|---|
| Forward P/E signals discount | Nvidia trades at 19–20x vs. a tech sector median of 34x and its own 5-year average of 53x. |
| PEG ratio confirms undervaluation | A forward PEG of 0.49 is less than half the sector median of 1.40, signaling growth is underpriced. |
| Geopolitical risk creates the gap | China revenue exclusion removes up to 20% of historical data center revenue from forecasts. |
| Growth trajectory remains strong | Analyst revenue forecasts reach $400B in 2026 and $555B in 2027, supporting the bull case. |
| Use multi-model valuation | Combining P/E, PEG, and intrinsic value models gives a more reliable fair value estimate than any single metric. |
Tickerplace's take on Nvidia's valuation
The data makes a clear case that the market is applying an excessive discount to Nvidia right now. A forward PEG of 0.49 on a company with 81% projected growth is not a nuanced undervaluation. It is a significant one. The fears driving that discount, primarily China revenue loss and competitive threats, are real but well-understood. Markets tend to overprice known risks.
What concerns me more is the risk investors take by ignoring the valuation signal entirely. Nvidia's revenue trajectory toward $555 billion by 2027 is not speculative. It is based on contracted AI infrastructure spending from some of the largest companies in the world. The competitive and geopolitical pressures are worth monitoring closely, but they do not justify pricing a high-growth leader below a value ETF.
The practical advice is to watch forward earnings revisions monthly. If estimates hold or rise while the share price stays compressed, the investment case strengthens. If estimates start falling, the discount may be warranted. Right now, the evidence points toward a market that is being more cautious than the fundamentals require.
— Tickerplace
Tickerplace tools for your NVIDIA valuation assessment
Running your own valuation model on Nvidia takes the analysis from interesting to personally useful. Tickerplace provides free, institutional-grade tools built for exactly this kind of work.

The Stock Valuation Calculator lets you input Nvidia's forward earnings estimates and growth rate to generate a P/E-based and intrinsic value-based fair value target. The Stock Valuation Checker runs real-time overvaluation and undervaluation alerts across thousands of US-listed equities, including NVDA, updated daily. Both tools are free and require no account. If you want to go deeper, the intrinsic value calculator at Tickerplace models DCF scenarios so you can stress-test Nvidia's fair value against different revenue growth assumptions.
FAQ
Is NVDA currently undervalued or overvalued?
Nvidia appears undervalued based on forward-looking metrics. Its forward P/E of 19–20x sits well below the tech sector median of 34x and its own five-year average of 53x.
What is Nvidia's forward PEG ratio right now?
Nvidia's forward PEG ratio is 0.49, compared to a sector median of 1.40. A PEG below 1.0 indicates the stock is undervalued relative to its expected growth rate.
Why is Nvidia trading at such a low valuation multiple?
Geopolitical export restrictions have removed China's data center revenue, historically up to 20% of the total, from analyst forecasts. Competitive fears from custom chip development by cloud providers add further pressure on the multiple.
Is NVDA a good investment for long-term investors?
Nvidia's revenue forecasts of $400 billion in 2026 and $555 billion in 2027 support a strong long-term growth case. Investors should size positions to account for geopolitical and competitive volatility while the discount persists.
How does Nvidia's valuation compare to AMD?
Nvidia trades at a forward P/E of 19x while AMD trades at 59x, reflecting the market's view that AMD is in an earlier, faster-accelerating phase of AI revenue growth despite Nvidia holding the dominant market position today.