

TL;DR:
- Apple stock is currently slightly overvalued, with its fair value estimated around $271 compared to a market price near $297.
- Technical signals indicate overbought conditions and a high risk of short-term pullbacks, suggesting cautious entry timing.
Apple stock is not undervalued by traditional metrics. At roughly $297 per share, fundamental models place Apple's fair value near $271, suggesting the stock trades at approximately 9% above intrinsic value. That gap matters for individual investors deciding whether to buy, hold, or wait. The question of whether Apple is undervalued or overvalued depends on which valuation method you apply, and the answer shifts when you layer in technical signals alongside discounted cash flow and P/E analysis.
Is Apple stock undervalued right now?
The short answer is no. Apple's current price reflects a premium that the market assigns to its brand strength, earnings consistency, and growth trajectory. Understanding why requires looking at the core valuation metrics that analysts and institutional investors use every day.
The standard industry term for this kind of analysis is intrinsic value assessment, which combines multiple models to estimate what a stock is actually worth independent of market sentiment. Tickerplace applies this approach through DCF, P/E, and P/S ratio models to generate daily fair value estimates.
Apple's trailing P/E sits at 36.1x and its forward P/E at 31.07x. Those multiples are high relative to Apple's 16.6% revenue growth rate, which means the market is pricing in continued strong execution. The PEG ratio of 2.61x reinforces this point. A PEG above 1.0 generally signals that a stock is priced above its growth rate, and 2.61x places Apple firmly in premium territory.
| Metric | Value |
|---|---|
| Trailing P/E | 36.1x |
| Forward P/E | 31.07x |
| PEG Ratio | 2.61x |
| Estimated fair value | $270.77 |
| Analyst consensus target | $308.07 |
| Market cap | $4.37 trillion |
The analyst consensus price target sits at approximately $308, which implies only about 3.4% upside from current levels. That is a thin margin for new buyers entering at $297. Investors who want to understand undervaluation methods in depth will find that Apple scores poorly on most value screens at this price.
Pro Tip: Never rely on a single valuation model. Cross-checking P/E, PEG, and DCF outputs gives you a more complete picture of whether a stock is genuinely cheap or just looks cheap on one metric.
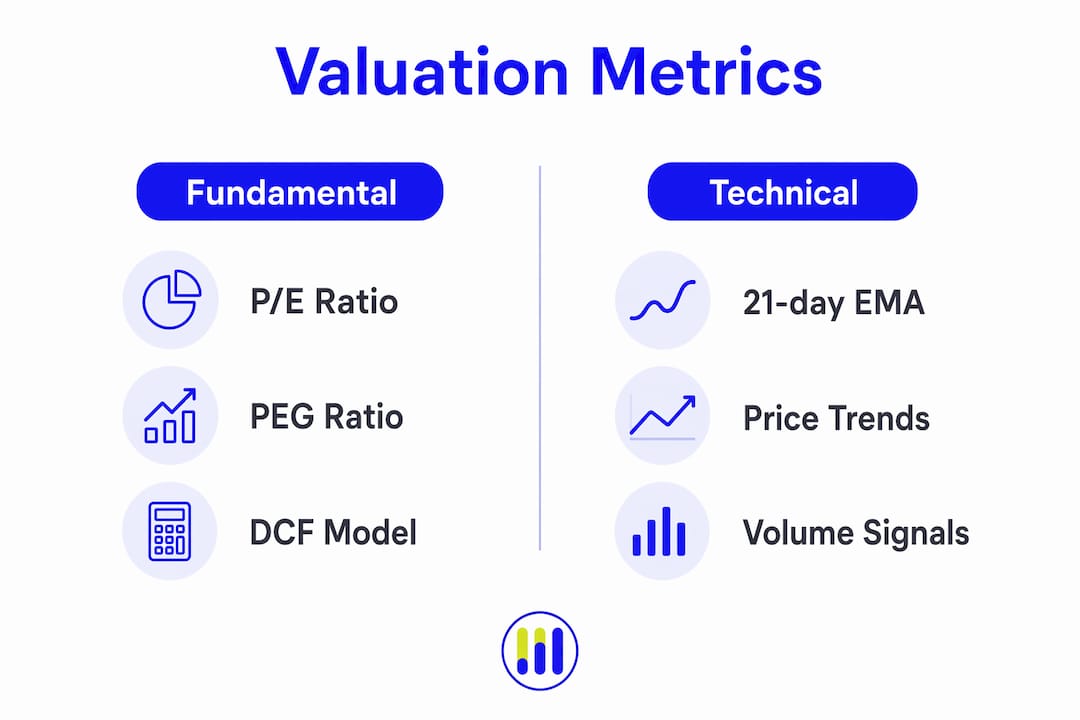
How technical analysis shapes the Apple valuation picture
Fundamental models tell you what a stock is worth. Technical analysis tells you when to buy it. For Apple, those two signals are currently pointing in different directions.

Investor's Business Daily defines Apple's technical buy zone between $288 and $303, based on moving averages and recent price action. Apple's 52-week high sits at $303.20, which means the stock is trading near the top of that range. Buying at the ceiling of a buy zone carries more risk than entering near the floor.
Key technical indicators to watch for Apple right now:
- RSI at 71.7. Apple's Relative Strength Index above 70 signals overbought conditions. Stocks with RSI above 70 are statistically more prone to near-term pullbacks.
- 21-day exponential moving average (EMA). The 21-day EMA acts as a short-term volatility buffer. Prices that stay above this line signal sustained momentum; prices that break below it often precede larger corrections.
- 50-day moving average. The 50-day moving average provides a medium-term trend signal. A drop below this level would shift the technical picture from bullish to neutral.
Technical buy zones and fundamental valuations often diverge, and relying solely on DCF models without factoring in price trends can mislead investors. Apple's fundamentals are solid, but its technical picture shows a stock running hot.
Pro Tip: Watch the 21-day EMA as your first warning signal. If Apple's price closes below it on high volume, that is a more reliable short-term caution flag than any single valuation ratio.
What risks and nuances should investors weigh?
Apple's premium valuation is not irrational. The company has earned its multiple through consistent earnings growth, a loyal customer base, and a services segment that generates high-margin recurring revenue. The risk is not that Apple is a bad company. The risk is that the current price already reflects all of that.
- Multiple compression risk. Apple's PEG of 2.61x means the market is pricing in strong growth. If growth slows, the multiple will compress even if earnings remain solid. A stock can fall in price while the underlying business stays healthy.
- Limited near-term upside. With the analyst consensus target at $308 and the current price near $297, the reward-to-risk ratio for new buyers is narrow. Chasing a stock with 3.4% upside and meaningful downside is a difficult trade to justify.
- Overbought technical conditions. An RSI of 71.7 does not mean Apple will drop tomorrow. It does mean the probability of a near-term pullback is elevated compared to when RSI sits in the 50–60 range.
- Entry strategy matters. Long-term investors without an Apple position can consider starting with a partial position near current levels, but watching for pullbacks toward $265–$275 offers a better risk-adjusted entry. That range sits closer to the intrinsic value estimate and provides a larger margin of safety.
Aligning your entry point with your investment horizon is the practical takeaway here. If you plan to hold Apple for a decade, paying a modest premium today matters less. If you are looking for a one-to-two-year trade, the current setup offers limited room for error.
Pro Tip: Avoid the value trap of waiting indefinitely for a "perfect" price. Set a target entry range, build a partial position, and add on confirmed pullbacks rather than trying to call the exact bottom.
How to use valuation tools to assess Apple for your portfolio
Knowing that Apple trades above its intrinsic value is useful. Knowing exactly how that gap affects your specific investment thesis is more useful. Tickerplace provides a set of free calculators that let you run your own numbers rather than relying on consensus estimates alone.
The core tools relevant to Apple stock analysis are:
- Stock valuation calculator. Combines P/E and intrinsic value models to generate a fair value estimate based on your own growth assumptions. Changing the growth rate input shows you how sensitive Apple's valuation is to even small shifts in earnings expectations.
- Intrinsic value calculator. Runs a DCF model using inputs you control, including discount rate and projected cash flows. This is the most direct way to test whether Apple's current price is justified under your personal assumptions.
- Stock average price calculator. Tracks your average cost basis across multiple purchases. Useful if you plan to build a position gradually by buying on dips.
| Tool | Primary use |
|---|---|
| Stock valuation calculator | P/E and intrinsic value modeling |
| Intrinsic value calculator | DCF analysis with custom inputs |
| Stock average price calculator | Cost basis tracking across purchases |
Running multiple models and comparing their outputs is the most reliable way to form a view on Apple's valuation. No single model is definitive. The Tickerplace Apple valuation page aggregates these signals into a single daily-updated view, which saves time and reduces the risk of anchoring to one number.
Key Takeaways
Apple stock is currently modestly overvalued by fundamental models, with a fair value near $271 against a market price near $297, making disciplined entry timing the most important variable for new investors.
| Point | Details |
|---|---|
| Apple is not undervalued | Fundamental models place fair value at $270.77, roughly 9% below the current price. |
| Premium multiples carry compression risk | A PEG of 2.61x means slowing growth could push the price lower even with solid earnings. |
| Technical signals show overbought conditions | An RSI of 71.7 and proximity to the 52-week high increase near-term pullback risk. |
| Analyst upside is limited | The consensus price target of $308 implies only 3.4% upside from current levels. |
| Better entries exist below current price | Pullbacks toward $265–$275 offer a more favorable risk-adjusted entry for long-term investors. |
Tickerplace's view on Apple's valuation in 2026
Apple's premium valuation is not a mistake. The market is paying up for a company with one of the strongest brand moats in history, a services business that prints high-margin cash, and a hardware ecosystem that keeps customers locked in for years. That premium is rational. The question is whether you are paying the right price for it today.
What concerns me about Apple at current levels is not the business. It is the math. A 3.4% gap between the current price and the analyst consensus target is not a margin of safety. It is barely a rounding error. Investors who buy here are essentially betting that analysts revise their targets upward, which requires Apple to deliver earnings growth above current expectations.
The smarter approach is to build a position in stages. Start with a partial allocation now if you have no exposure. Set a limit order in the $265–$275 range and add meaningfully if the stock pulls back there. Check Apple's fundamentals quarterly rather than reacting to daily price moves. Economic shifts and Apple's product pipeline, particularly in AI-integrated hardware, will be the real drivers of whether today's premium looks cheap in three years or expensive in one.
— Tickerplace
Tickerplace tools for your Apple stock analysis
Individual investors who want to move beyond headline price targets and run their own Apple stock valuation have a free, institutional-grade option in Tickerplace.

The stock valuation checker gives you an instant read on whether Apple is overvalued or undervalued based on multi-model analysis, updated daily. For a deeper dive, the intrinsic value calculator lets you input your own growth assumptions and discount rate to generate a personalized fair value estimate. If you are building a position gradually, the stock average price calculator tracks your cost basis across every purchase. Accurate inputs produce accurate outputs, and that accuracy is what separates informed investing from guesswork.
FAQ
Is Apple stock overvalued or undervalued right now?
Apple is modestly overvalued based on fundamental models. Fair value estimates place Apple near $271, while the stock currently trades around $297.
What is Apple's analyst consensus price target?
The analyst consensus price target for Apple is approximately $308, implying roughly 3.4% upside from current price levels.
What P/E ratio does Apple trade at?
Apple trades at a trailing P/E of 36.1x and a forward P/E of 31.07x, both of which are elevated relative to its 16.6% revenue growth rate.
Is Apple a good buy at current prices?
Apple is a quality business, but the current price offers limited upside and elevated technical risk. Long-term investors may consider waiting for a pullback toward $265–$275 for a better entry.
What is Apple's technical buy zone?
Investor's Business Daily defines Apple's technical buy zone between $288 and $303, based on moving averages and recent price action.