

TL;DR:
- Market trend analysis detects sustained movements in price, volume, and economic data to guide investment choices. Investors must confirm trends across multiple signals and timeframes to reduce noise and avoid misclassification of short-term spikes as long-term shifts. Using diverse data sources and structured methods improves decision accuracy and reduces investment risk.
Market trend analysis is defined as the systematic process of detecting sustained directional movements in price, volume, and economic data to inform investment decisions. Knowing how to identify market trends separates investors who react to noise from those who act on signal. The global market research industry reached an estimated $150 billion in value in 2026, growing at 8.4% annually. That scale reflects how seriously institutions treat trend tracking. This guide gives individual investors and analysts the same disciplined framework, without the institutional budget.
How to identify market trends: types and timeframes
Market trends fall into three categories: short-term, intermediate, and long-term. Each operates on a different timeframe and carries a different level of signal reliability.

Short-term trends last days to weeks. They are highly sensitive to news events, earnings releases, and sentiment shifts. Most of the movement in short-term trends is noise, not signal.
Intermediate trends span weeks to several months. These reflect genuine shifts in sector momentum or macroeconomic conditions. Intermediate trends are where most individual investors find the most useful entry and exit signals.
Long-term trends unfold over years. They capture structural changes in industries, such as the multi-decade shift from fossil fuels to renewable energy. Long-term trends form the backbone of a sound portfolio thesis.
The most common mistake investors make is misclassifying a short-term price spike as a long-term trend. A stock rising 20% in two weeks on speculative volume is not a trend. A stock rising steadily over six months on increasing volume, improving fundamentals, and rising analyst coverage is.
- Price patterns: Consistent higher highs and higher lows signal an uptrend. Consistent lower highs and lower lows signal a downtrend.
- Volume confirmation: A price move on rising volume is more credible than one on thin volume.
- Momentum indicators: Tools like the Relative Strength Index (RSI) and Moving Average Convergence Divergence (MACD) measure the speed and direction of price changes.
- Breadth signals: When most stocks in a sector rise together, the trend is broad-based and more durable.
Pro Tip: Never declare a trend from a single data point. Require at least three consistent signals across different indicators before treating a directional move as a confirmed trend.
What data sources and tools do you need for trend analysis?
Accurate trend identification requires multiple independent data streams. Relying on price charts alone produces incomplete analysis.
Consumer feedback data tends to shift ahead of formal market reports, making it one of the fastest leading indicators available. Monitoring product reviews, app store ratings, and customer sentiment forums gives investors an early read on demand changes before they appear in quarterly earnings.
The table below outlines the core data sources, their best uses, and the recommended monitoring cadence.
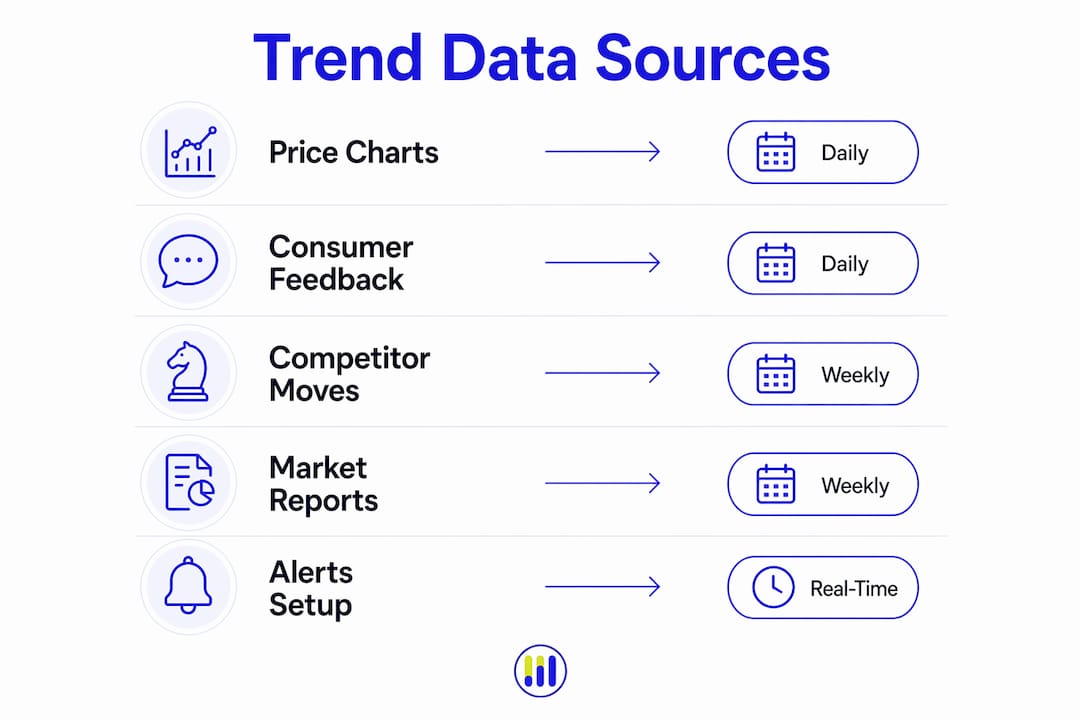
| Data source | Best use | Monitoring cadence |
|---|---|---|
| Price and volume charts | Confirm trend direction and strength | Daily |
| Economic indicators (CPI, GDP, PMI) | Assess macro environment | Monthly or quarterly |
| Search volume trends (Google Trends) | Detect rising consumer interest | Weekly |
| Social media sentiment | Gauge retail investor and consumer mood | Daily |
| Competitor pricing and campaigns | Identify strategic market shifts | Weekly |
| Analyst reports and earnings calls | Validate fundamental trend drivers | Quarterly |
A multi-source cadence approach prevents two common failures: missing key signals because you check data too infrequently, and burning out on noise because you check it too often. Daily monitoring suits social sentiment and news. Weekly suits competitor tracking. Monthly suits pattern review. Quarterly suits strategic alignment.
Competitor price changes often signal repositioning rather than simple cost adjustments. When a major player in a sector cuts prices aggressively, it may indicate falling demand or a land-grab strategy. Both interpretations carry investment implications.
Pro Tip: Set up Google Alerts for key companies and sectors in your investment universe. Pair that with a weekly review of Google Trends data for relevant search terms. This two-layer system catches both news-driven and demand-driven signals.
Step-by-step method to spot and validate genuine trends
A repeatable process produces more reliable trend identification than ad hoc observation. The following six steps form a practical framework for individual investors and analysts.
-
Define your investment universe. Choose the specific sectors, industries, or market segments you will monitor. Trying to track everything produces nothing useful.
-
Collect data across multiple sources. Pull price and volume data, search trends, consumer sentiment, and competitor activity. Use the cadence table above to set your review schedule.
-
Apply a consistent analysis window. An effective analysis window for trend identification ranges from 90 to 180 days, paired with a 6 to 12 month comparison against prior baselines. This window is long enough to filter noise but short enough to remain current.
-
Cluster signals into themes. Group related signals together. If search volume for a product category rises, social sentiment turns positive, and a sector ETF breaks to new highs simultaneously, those signals form a coherent theme.
-
Validate across independent sources. Genuine trends show synchronized changes across rising search volume, positive social sentiment, and competitor repositioning over 6 to 12 months. A signal that appears in only one data stream is a candidate, not a confirmed trend.
-
Decide and document. Once a trend is validated, determine whether it supports buying, holding, or reducing a position. Write down your reasoning. Documented decisions are easier to review and refine over time.
Manual competitor monitoring for one week, tracking campaign launches, messaging shifts, and pricing changes, reveals repeatable patterns that automated tools often miss. This is especially true in sectors where strategic moves happen faster than data aggregators can capture them.
Pro Tip: Build a simple spreadsheet that logs each signal, its source, and the date observed. After 90 days, review it for patterns. The discipline of logging forces you to distinguish genuine signals from gut reactions.

How do you interpret trends to make smarter investment decisions?
Identifying a trend is only half the work. Interpreting it correctly determines whether you act profitably or poorly.
Effective trend identification provides a decision-making roadmap that helps you avoid over-investment in declining markets or obsolete technologies. A downtrend in a sector, confirmed across price, volume, and sentiment data, is a clear signal to reduce exposure, regardless of how attractive a stock's valuation appears in isolation.
Trend analysis works best when combined with fundamental valuation. A stock in a confirmed uptrend with an undervalued intrinsic value estimate presents a stronger case than either signal alone. Conversely, a stock in a downtrend that appears cheap on a price-to-earnings basis may be cheap for a reason. Understanding market data for investment decisions helps you weigh both dimensions together.
- Use trends to time entries and exits. Entering a position aligned with an intermediate uptrend improves the probability of a positive outcome.
- Avoid fighting confirmed downtrends. Valuation alone does not stop a falling price. Wait for trend reversal signals before buying into weakness.
- Adjust position sizing by trend strength. A strong, broad-based trend warrants a larger position. A weak or narrow trend warrants caution.
- Combine trend signals with sector analysis. A rising stock in a declining sector carries more risk than the same stock in a rising sector.
Market analysis reduces investment risk by grounding decisions in measurable data rather than attempting to predict the future perfectly. That reframe matters. The goal is not certainty. The goal is better odds.
Key Takeaways
Identifying market trends accurately requires combining multiple data streams, consistent monitoring cadence, and fundamental valuation to reduce risk and improve investment timing.
| Point | Details |
|---|---|
| Define trend timeframes | Short-term, intermediate, and long-term trends require different analysis approaches and signal thresholds. |
| Use multiple data sources | Price charts, search volume, sentiment, and competitor activity must align before a trend is confirmed. |
| Apply a structured time window | Monitor data over 90–180 days and compare against a 6–12 month baseline to filter noise. |
| Combine trends with valuation | Trend signals gain strength when paired with fundamental analysis tools like DCF or P/E models. |
| Document every decision | Logging signals and reasoning builds a reviewable record that sharpens future trend identification. |
Tickerplace's perspective on mastering market trend identification
The most common mistake investors make is treating trend analysis as a prediction exercise. It is not. Market analysis is about reducing uncertainty with current, measurable information, not eliminating it. That distinction changes how you use the data.
Tickerplace has observed that investors who struggle most with trend analysis are those who look for confirmation of a decision they have already made. They find one signal that supports their thesis and stop looking. The discipline of requiring synchronized signals across multiple independent sources is what separates analysis from rationalization.
Patience is the other underrated factor. A trend that takes three months to confirm is more reliable than one you declared after three days. Markets reward investors who wait for the weight of evidence, not those who act on the first signal. Combining that patience with a structured market overview process produces consistently better outcomes than reactive decision-making.
— Tickerplace
Apply trend insights with Tickerplace's valuation tools
Spotting a trend is the starting point. Knowing whether the stocks within that trend are fairly priced is what determines whether you act.

Tickerplace provides free, institutional-grade valuation tools that complement your trend analysis directly. The intrinsic value calculator uses DCF modeling to estimate a stock's fair value, so you can assess whether a trending stock is still worth buying at its current price. The stock valuation calculator applies P/E and P/S ratio models across thousands of US and ASX-listed equities, updated daily. When you identify a trend and want to act on it, these tools give you the fundamental grounding to do so with confidence.
FAQ
What is a market trend in investing?
A market trend is a sustained directional movement in price, volume, or economic data over a defined period. Trends are classified as short-term (days to weeks), intermediate (weeks to months), or long-term (months to years).
How long does it take to confirm a market trend?
An effective confirmation window spans 90 to 180 days of active monitoring, compared against a 6 to 12 month baseline. Shorter windows increase the risk of mistaking noise for a genuine trend.
Why should investors monitor market indices?
Market indices reflect the aggregate direction of broad market segments. Monitoring them reveals whether a stock's movement is driven by sector-wide forces or company-specific factors, which directly affects how you interpret individual trend signals.
What is the difference between a trend and market noise?
A trend shows synchronized signals across multiple independent data sources over several months. Noise appears in one or two sources for a short period and fails to persist when cross-checked against search volume, sentiment, and competitor behavior.
How does trend analysis reduce investment risk?
Trend analysis reduces risk by grounding decisions in measurable, current data rather than speculation. Investors who align positions with confirmed trends avoid the most common error of buying into declining markets based on valuation alone.