

TL;DR:
- Fundamental analysis estimates a stock’s true value by examining financial statements, industry, and economic factors. It combines quantitative data and qualitative judgments to identify undervalued or overvalued stocks for long-term investing. Investors often use both fundamental and technical analysis to decide what to buy and when to buy or sell.
Fundamental analysis is defined as the process of estimating a stock's intrinsic value by examining a company's financial statements, competitive position, and the broader economic environment. The goal is straightforward: determine whether a stock is undervalued or overvalued relative to what the business is actually worth. This method draws on three core financial documents, the income statement, balance sheet, and cash flow statement, alongside macroeconomic and industry factors. When you analyze company fundamentals with discipline, you build a fact-based investment thesis rather than reacting to market noise.
What is fundamental analysis, and how does it work?
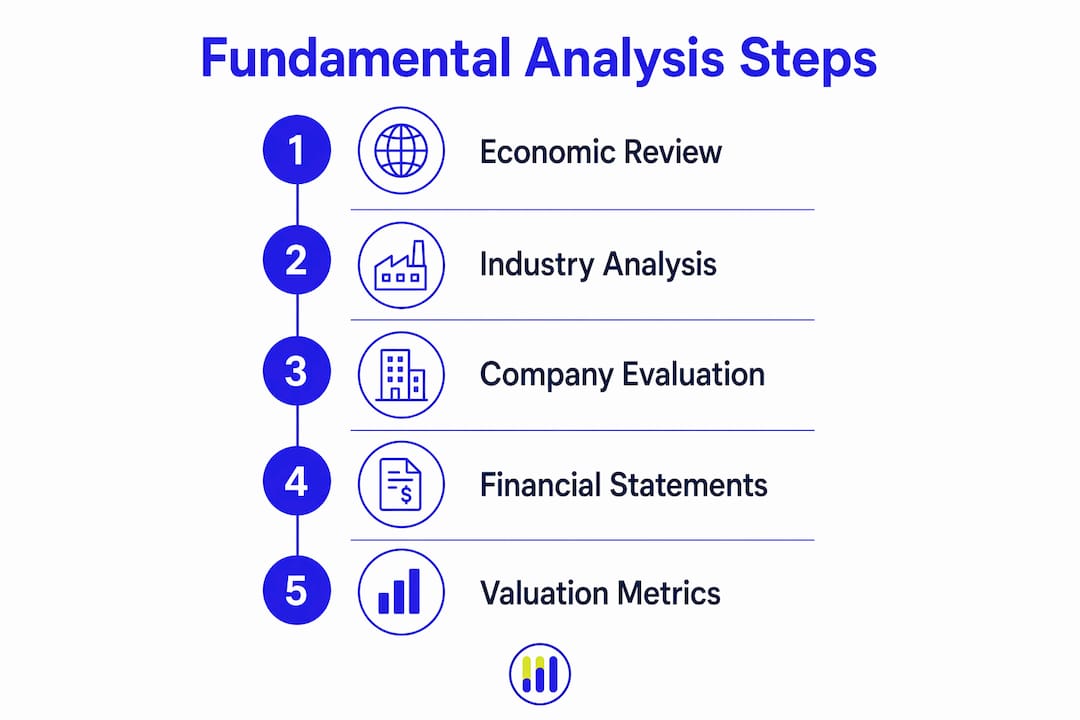
Fundamental analysis involves three levels: economic, industry, and company-specific analysis, each building toward an intrinsic value estimate. Think of it as a layered research process. You start wide, then narrow your focus to the individual business.
The workflow follows a clear sequence:
- Economic analysis. Assess macroeconomic conditions such as interest rates, inflation, GDP growth, and employment trends. These factors set the backdrop for every business operating in the market.
- Industry analysis. Evaluate sector dynamics, competitive intensity, regulatory environment, and growth trends within the specific industry the company operates in.
- Company analysis. Review the company's financial health, earnings quality, management effectiveness, and competitive position relative to peers.
- Valuation. Apply valuation models such as discounted cash flow (DCF), Price-to-Earnings (P/E) ratio, or Price-to-Sales (P/S) ratio to estimate fair value.
- Decision. Compare the estimated intrinsic value to the current market price to judge whether the stock offers a margin of safety.
The P/E ratio is one of the most widely used valuation metrics. It measures how much investors pay per dollar of earnings, and comparing it against historical averages or sector peers quickly reveals whether a stock looks cheap or expensive.
Pro Tip: Before building any valuation model, verify that the company's reported earnings are backed by real cash flow. A rising net income that does not translate into operating cash flow is a warning sign worth investigating.
How do investors use financial statements and ratios?
The income statement, balance sheet, and cash flow statement form what analysts call the "financial trinity." Each document answers a different question about the business.
- Income statement: Shows revenue, expenses, and net profit over a period. It tells you whether the business is growing and how profitable it is.
- Balance sheet: Captures assets, liabilities, and shareholder equity at a point in time. It reveals financial stability and how much debt the company carries.
- Cash flow statement: Tracks actual cash moving in and out of the business. It confirms whether reported profits are real.
Gross margin is one of the most telling ratios in this process. Tech firms often carry gross margins above 40%, while high-competition retail sectors may operate at just 3–5%. That gap reflects pricing power and competitive advantage, not just industry convention. A company with consistently high gross margins can reinvest more into growth without diluting profitability.
Return on Invested Capital (ROIC) is another metric worth tracking. It measures how efficiently a company generates returns from the capital it deploys. A business with a high and stable ROIC over multiple years typically has a durable competitive edge.

Cross-referencing all three financial statements is the most reliable way to verify earnings quality. When net income rises but operating cash flow stays flat or falls, that discrepancy signals potential manipulation or aggressive accounting. Spotting these red flags early protects you from overpaying for a business that looks profitable on paper but is not generating real cash.
Pro Tip: Use the intrinsic value calculator on Tickerplace to cross-check your manual DCF estimates against model-generated fair value targets for thousands of listed companies.
| Metric | What it measures | What to watch for |
|---|---|---|
| P/E ratio | Earnings relative to price | Compare to sector average and historical range |
| Gross margin | Profitability after direct costs | Higher margins signal pricing power |
| ROIC | Capital efficiency | Consistent high ROIC indicates durable advantage |
| Operating cash flow | Real cash generation | Should track closely with reported net income |
What qualitative factors influence fundamental analysis?
Numbers tell you what happened. Qualitative factors tell you why, and whether it will continue. Management quality and competitive moats are as important to long-term valuation as any ratio on a spreadsheet.
Qualitative analysis covers four key areas:
- Management effectiveness. Look at capital allocation decisions, track record of execution, and how leadership communicates with shareholders. Poor capital allocation destroys value even in a profitable business.
- Competitive moats. A moat is a structural advantage that protects a company's profits from competitors. Common moat types include network effects, switching costs, cost advantages, and intangible assets such as patents or brand recognition.
- Corporate governance. Examine board independence, insider ownership, and compensation structures. High insider ownership often aligns management incentives with shareholder returns.
- Industry trends. A company can have strong financials today but operate in a structurally declining industry. Qualitative context prevents you from anchoring too heavily on historical numbers.
Combining qualitative judgment with quantitative data produces a more complete risk assessment. A business with strong financials and a wide moat is far more likely to sustain its performance than one with strong financials alone.
How does fundamental analysis differ from technical analysis?
Technical analysis focuses on price trends, volume patterns, and market sentiment rather than business fundamentals. It asks: where is the price going? Fundamental analysis asks: what is this business worth?

| Dimension | Fundamental analysis | Technical analysis |
|---|---|---|
| Primary focus | Intrinsic business value | Price trends and chart patterns |
| Data used | Financial statements, ratios, economics | Price, volume, moving averages |
| Time horizon | Long-term (months to years) | Short to medium-term (days to weeks) |
| Core question | Is this stock undervalued? | Is this stock trending up or down? |
Prices can deviate from estimated fair value for extended periods due to market sentiment and unexpected events. That gap is where patient, fundamentals-driven investors find their best opportunities. Many investors combine both approaches: fundamental analysis to identify what to buy, and technical analysis to judge when to enter or exit a position. Neither method is complete on its own, but together they cover both the "what" and the "when" of investing.
Key Takeaways
Fundamental analysis is the most reliable framework for estimating intrinsic stock value, combining financial statement review, ratio analysis, qualitative judgment, and macroeconomic context.
| Point | Details |
|---|---|
| Three-level framework | Start with economic conditions, then industry dynamics, then company-specific financials. |
| Financial trinity | Income statement, balance sheet, and cash flow statement each reveal a different dimension of business health. |
| Gross margin signals | Tech firms often exceed 40% gross margin; retail may sit at 3–5%, reflecting competitive intensity. |
| Qualitative factors matter | Management quality, competitive moats, and governance shape long-term value beyond what ratios show. |
| Combine both methods | Use fundamental analysis for stock selection and technical analysis for trade timing. |
Tickerplace's take on mastering fundamental analysis
Fundamental analysis is not an exact science. No single metric or valuation method tells the full story, and professional investors consistently use multiple frameworks before forming a conviction. That reality should be reassuring, not discouraging. It means the goal is not to find a perfect formula but to build a repeatable, disciplined research process.
The investors who perform best over time are not the ones who find the cleverest model. They are the ones who verify their assumptions, check their data across multiple sources, and resist the urge to anchor on a single number. Patience matters more than precision. A stock that is 20% undervalued today may take two years to reflect that value, and you need the conviction to hold through the noise.
One practical habit worth building: always cross-reference your valuation estimate against at least two methods. If your DCF and your P/E-based estimate point in the same direction, your conviction is better grounded. If they diverge sharply, that divergence is worth understanding before you commit capital. Tools like the stock valuation calculator on Tickerplace make this cross-check fast and accessible for individual investors.
— Tickerplace
Tickerplace: stock valuation tools built for individual investors
Applying fundamental analysis by hand is time-consuming. Tickerplace removes that friction by providing institutional-grade valuation tools at no cost to individual investors.

The stock valuation checker on Tickerplace runs multi-model valuation across DCF, P/E, and P/S frameworks for thousands of US and ASX-listed companies, updated daily. You can review full financial statements, estimate intrinsic value, and check margin of safety without building a spreadsheet from scratch. For investors learning the fundamentals of stock analysis, these tools translate the concepts in this guide into real numbers on real companies. Start with any stock you are researching and let the data guide your next decision.
FAQ
What is the main goal of fundamental analysis?
Fundamental analysis aims to estimate a stock's intrinsic value by examining financial statements, economic conditions, and competitive position. The goal is to identify whether a stock is undervalued or overvalued relative to its true worth.
What are the three core financial statements used in fundamental analysis?
The income statement, balance sheet, and cash flow statement form the foundation of fundamental analysis. Together they reveal profitability, financial stability, and real cash generation.
How does the P/E ratio fit into fundamental analysis?
The Price-to-Earnings ratio measures how much investors pay per dollar of earnings. Comparing it against sector peers and historical averages helps determine whether a stock is priced fairly.
Can fundamental analysis be wrong?
Yes. Prices can deviate from estimated fair value for extended periods due to market sentiment and unexpected events. Fundamental analysis supports informed judgment but does not guarantee a specific outcome.
How is fundamental analysis different from technical analysis?
Fundamental analysis evaluates business value using financial and economic data, while technical analysis focuses on price trends and chart patterns. Many investors use both: fundamentals to select stocks and technicals to time entries.