
TL;DR:
- A long-term stock trading strategy is a rule-based plan combining valuation models with market filters to time entries and exits. It emphasizes using intrinsic value estimates, technical trend confirmations, risk management rules, and backtesting to ensure disciplined investing. Tickerplace offers tools that operationalize these valuation and trading principles for individual investors.
For long-term stock investors, a trading strategy is a rule-based plan that combines valuation thresholds with market-condition filters to time entries and exits. It is not a collection of indicators or a gut feeling about a stock's direction. The recommended approach: use institutional valuation models (DCF, P/E, or P/S) to set entry thresholds, add a trend or momentum filter to avoid buying into late-stage rallies, and fix position sizing plus stop rules before placing a single trade. Common risk-adjusted metrics, such as the Sharpe ratio and maximum drawdown, can be used to evaluate performance.
Table of Contents
- What framework should you use for explaining trading strategies?
- Which investment strategies work best for long-term stock investors?
- How do you build a strategy you can actually follow?
- How do valuation models translate into actual buy and sell triggers?
- What risk controls protect a long-term strategy from serious damage?
- How do you test a strategy and know if the results are credible?
- Key Takeaways
- The case for rules over conviction
- Tickerplace puts these valuation rules to work for you
- Useful sources
- FAQ
What framework should you use for explaining trading strategies?
Trading strategies rest on two analytical frameworks: fundamental analysis and technical analysis. Most long-term investors benefit from using both, with valuation driving the decision and technicals providing timing confirmation.
Fundamental analysis centers on estimating intrinsic value through models like DCF (discounted cash flow), P/E (price-to-earnings), and P/S (price-to-sales). The output is a fair-value estimate; the entry rule is to buy when the market price sits meaningfully below that estimate. Understanding company fundamentals is the foundation of this approach.
Technical analysis focuses on price, volume, and market behavior. Tools like the 50-day and 200-day exponential moving averages (EMA), RSI, and On-Balance Volume serve as timing and confirmation signals rather than standalone buy triggers. For a long-term investor, a stock trading below its 200-day EMA after a prolonged downtrend may be cheap on a DCF basis but still heading lower.
| Dimension | Fundamental analysis | Technical analysis |
|---|---|---|
| Primary signal | Intrinsic value vs. market price | Price trend, momentum, volume |
| Best use | Entry/exit thresholds, fair-value bands | Market-condition filter, timing |
| Typical timeframe | Months to years | Days to weeks |
| Data required | Financial statements, discount rates | Price and volume history |
| Main limitation | Valuation can stay "wrong" for years | No intrinsic-value anchor |
When to rely primarily on valuation:
- Price is more than 20% below a DCF or P/E fair-value estimate and the business fundamentals are intact.
- You are sizing a core, multi-year position where short-term price noise is acceptable.
When to wait for technical confirmation:
- The stock is in a clear downtrend (price below the 200-day EMA) despite cheap valuation.
- Broad market conditions suggest elevated systemic risk (e.g., inverted yield curve, credit spread widening).
Which investment strategies work best for long-term stock investors?
Technical and fundamental approaches can be combined across several strategy types that suit long holding periods.
Value investing is the most direct application of fundamental analysis. The buy rule: enter when the market price is at or below intrinsic value minus a margin of safety (typically 20–30%). The sell rule: trim when price approaches or exceeds the fair-value estimate, or when the original investment thesis breaks. Holding periods typically span long durations compatible with long-term investment horizons.
Dividend-growth investing adds an income layer. Entry requires a stable or growing payout ratio, a reasonable P/E or P/S valuation, and a dividend yield supported by free cash flow. Exit triggers include a dividend cut, a payout ratio that exceeds sustainable levels, or a valuation that has stretched well above fair value. Tax treatment of qualified dividends and DRIP (dividend reinvestment plan) choices affect net returns meaningfully.

Momentum overlay keeps core holdings intact but adds rules for adding to or trimming positions based on multi-month price signals. A practical rule: add to a position when the 50-day EMA crosses above the 200-day EMA (a "golden cross") and trim when the reverse occurs. This is not day trading; it is disciplined position management.
Trend-following at longer horizons uses weekly or monthly moving averages to avoid buying into late-stage rallies. Longer moving averages (50- and 200-period on weekly charts) define the trend; entries come on pullbacks, and trailing stops are set by multi-week lows. This approach suits investors who cannot monitor intraday moves.
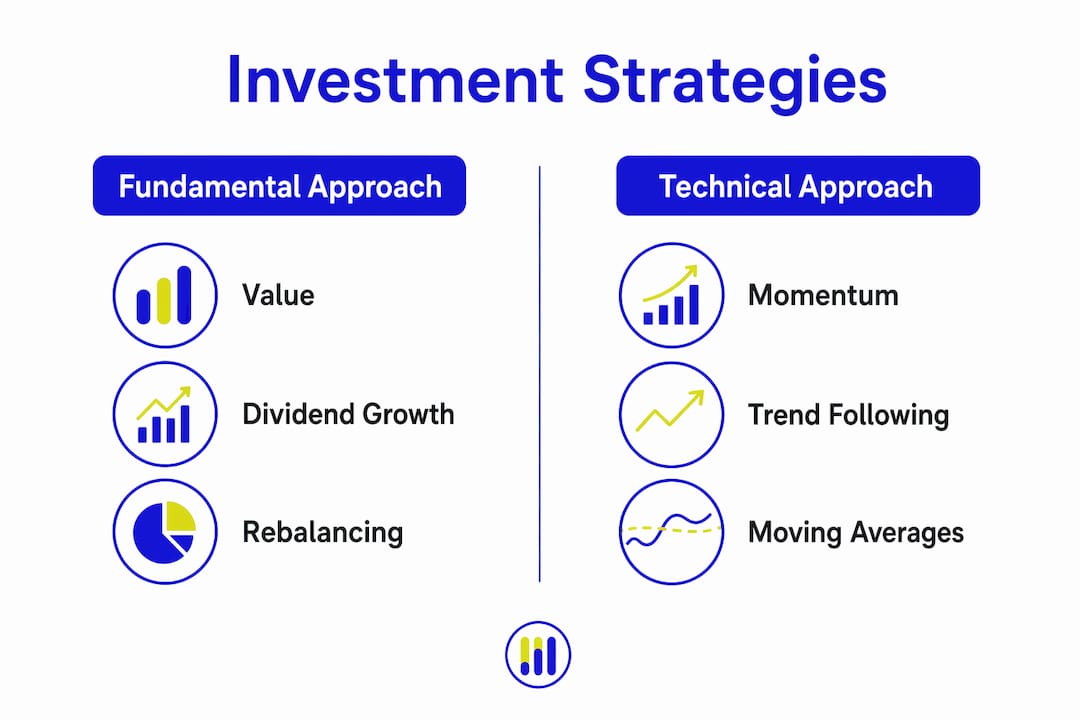
Rebalancing rules operate at the portfolio level. Calendar-based rebalancing (quarterly or annually) or threshold-based rebalancing (when an allocation drifts more than 5 percentage points from target) captures discipline and controls concentration risk without requiring constant monitoring.
How do you build a strategy you can actually follow?
A repeatable strategy requires six concrete steps before a single dollar goes to work.
- Define your objective and universe. Specify the asset class, market cap range, and style (e.g., US large-cap value, dividend growers with 10+ years of consecutive increases).
- Select valuation model(s) and set an entry threshold. Choose DCF, P/E, or P/S as your primary model and define the margin of safety. Example: buy only when market price ≤ 0.80 × intrinsic value.
- Add a market-condition filter. Write an explicit rule: "Only initiate new positions when the stock's price is above its 20-week EMA." This single filter eliminates most purchases made into deteriorating trends.
- Set position sizing rules. A 1% risk-per-trade rule on a $100,000 portfolio means risking no more than $1,000 per position. A 2% rule allows $2,000. Neither is universally correct; the right number depends on your drawdown tolerance and portfolio concentration limits.
- Define stop-loss and take-profit rules. Set a hard stop before entry and commit to it. Moving a stop to avoid being triggered is one of the most account-damaging habits in discretionary trading.
- Backtest, then paper-trade. Run the rules against historical data, then forward-test in a simulated environment before committing real capital. Set a predetermined review cadence (quarterly is practical for most long-term strategies).
Pro Tip: Limit your strategy to 2–3 indicators. Practitioners consistently find that simplicity outperforms complexity — more signals create conflicting rules, not better decisions.
How do valuation models translate into actual buy and sell triggers?
DCF, P/E, and P/S outputs become mechanical rules when you attach specific thresholds to them. Consider a stock with a DCF-derived intrinsic value of $100. Applying a 25% margin of safety sets the buy trigger at $75 or below. If the stock later trades at $110 (10% above intrinsic value), that is a trim signal.
Concrete entry and exit rules tied to valuation outputs:
- Buy when market price ≤ 0.80 × intrinsic value (20% margin of safety).
- Add to an existing position when price ≤ 0.75 × intrinsic value and the trend filter is positive.
- Hold when price is between 0.80 × and 1.10 × intrinsic value and fundamentals are unchanged.
- Trim when price ≥ 1.10 × intrinsic value or when P/E exceeds the sector's historical 75th percentile.
- Exit when the original investment thesis is broken (earnings power deteriorates, debt load becomes unsustainable).
P/E and P/S fair-value bands add a second layer of confirmation. If a stock's P/E is 35× against a sector median of 18×, the valuation model signals overextension even if the DCF still shows modest upside. Using both models together reduces the risk of anchoring on a single flawed assumption.
Tickerplace operationalizes these steps directly. Its intrinsic value calculator generates DCF-based estimates, and the stock valuation calculator runs P/E and P/S models side by side. Daily fair-value updates across 10,000+ US and ASX equities mean your entry thresholds stay current without manual recalculation.
What risk controls protect a long-term strategy from serious damage?
Position sizing is the first line of defense. The 1–2% risk-per-trade rule limits the damage any single position can do to a portfolio. Pair it with a portfolio-level maximum drawdown limit (many long-term investors set this at 20–25% from peak) and a diversification rule that caps any single sector at 25–30% of total holdings.
Leverage deserves a separate warning. Margin fundamentally changes the risk profile of any strategy: losses can exceed initial capital, and stop-losses become mandatory rather than optional. For long-term investors, leverage is rarely justified outside of very specific, well-tested scenarios.
The most common beginner mistakes:
- Neglecting exit rules. Experts consistently identify exit strategy neglect as the primary driver of poor outcomes. Define your exit before you enter.
- Overfitting the backtest. Curve-fitting rules to historical data produces strategies that look perfect in hindsight and fail immediately in live trading.
- Moving stops. Adjusting a stop-loss downward to avoid being triggered converts a defined risk into an open-ended loss.
- Ignoring transaction costs and taxes. Frequent rebalancing in a taxable account can erode returns significantly; model these costs before going live.
Pro Tip: Set stop-loss levels relative to the stock's average true range (ATR), not arbitrary round numbers. A stop placed at 1.5× ATR below entry accounts for normal volatility and reduces the chance of being stopped out by routine price noise.
How do you test a strategy and know if the results are credible?
Statistical credibility requires volume. Backtests with fewer than 100 trades are generally noise; aim for 200 or more trades across varied market regimes (bull, bear, and sideways) before drawing conclusions. A strategy tested only on the 2019–2021 bull market tells you very little about its behavior in a drawdown environment.
Backtesting must include realistic transaction costs, slippage estimates, and tax modeling for realized gains. Walk-forward analysis (testing on rolling out-of-sample windows) and paper trading in live market conditions are the two most reliable checks against curve-fitting.
| Metric | What it measures | Practical threshold |
|---|---|---|
| CAGR | Annualized compound return | Benchmark the S&P 500 as a minimum hurdle |
| Max drawdown | Largest peak-to-trough loss | < 30% for aggressive long-term strategies |
| Sharpe ratio | Return per unit of risk | > 0.6 is a reasonable floor for credibility |
| Win rate | Percentage of profitable trades | Context-dependent; high win rate with small wins can still lose money |
| Expectancy | Average profit per trade (wins × avg win) minus (losses × avg loss) | Must be positive |
Key Takeaways
A well-built trading strategy for long-term investors pairs valuation-based entry thresholds with a market-condition filter, strict position sizing, and non-negotiable exit rules tested across a sufficient number of historical trades to ensure statistical confidence.
| Point | Details |
|---|---|
| Valuation-first entry | Buy only when market price falls below intrinsic value minus a margin of safety (e.g., ≤ 0.80 × DCF value). |
| Market-condition filter | Add a trend rule (e.g., price above 20-week EMA) to avoid entering deteriorating positions. |
| Position sizing discipline | Apply a 1–2% risk-per-trade rule to limit single-position damage to a defined, tolerable amount. |
| Non-negotiable exit rules | Define stop-loss and take-profit levels before entry; moving stops is one of the most damaging habits in trading. |
| Tickerplace for implementation | Tickerplace's intrinsic value calculator, stock valuation calculator, and daily fair-value updates operationalize each step above. |
The case for rules over conviction
The most persistent misconception about long-term investing is that deep conviction in a business makes systematic rules unnecessary. It does not. Conviction tells you what to own; rules tell you when to buy, how much to hold, and when to exit regardless of how you feel about the company. The investors who consistently outperform are not the ones with the best stock picks. They are the ones who follow a repeatable process: screen for valuation, confirm with a trend filter, size the position according to a fixed rule, and review on a predetermined cadence (daily scan, weekly technical check, quarterly valuation review). The strategy is the discipline, and the discipline is what survives bear markets. Without objective, testable rules, even a correct thesis can produce a loss because the entry was too early, the position too large, or the exit too late. Build the rules first. The conviction follows.
Tickerplace puts these valuation rules to work for you
Individual investors now have access to the same multi-model valuation framework that institutional analysts use, without the institutional cost. Tickerplace provides DCF, P/E, and P/S valuations updated daily across 10,000+ US and ASX equities, along with dedicated calculators that map directly to the entry and exit rules described in this guide.

The intrinsic value calculator generates your buy threshold in seconds. The stock valuation checker screens whether a stock is currently overvalued or undervalued against multiple models simultaneously. The margin-of-safety calculator, side-by-side stock comparison, and sector analysis tools round out a complete research workflow. For deeper analysis including full DCF breakdowns, scenario modeling, and historical financials, Tickerplace Pro unlocks the next level. Run your first valuation check free at Tickerplace today.
Useful sources
- Trading strategy — Wikipedia: authoritative overview of strategy types, development steps, and performance measurement frameworks.
- Trading strategy — Investopedia: clear definitions of entry/exit rules, position sizing, and common beginner mistakes including exit neglect.
- All about trading strategies — Saxo: practical primer on combining technical and fundamental frameworks for confirmation.
- Trading Strategies That Actually Work — Adatrix: covers backtesting standards, sample-size requirements, and trend-following mechanics.
- Technical analysis strategies — TrendSpider: explains volume-based tools and oscillators as timing and confirmation signals.
- Simple trading strategy advice — Technical Analysis Pro: practitioner case for limiting indicators to 2–3 reliable signals.
- Trading for beginners — IG: covers leverage risk, mandatory stop-loss use, and conservative sizing principles.
- Intrinsic Value Calculator — Tickerplace: DCF-based calculator for building entry thresholds and margin-of-safety rules.
- Stock Valuation Calculator — Tickerplace: multi-model P/E and intrinsic value calculator for setting fair-value bands.
FAQ
What is a trading strategy for long-term investors?
A trading strategy for long-term investors is a rule-based plan that uses valuation models (DCF, P/E, P/S) to set entry and exit thresholds, combined with a market-condition filter and fixed position-sizing rules to manage risk.
How does a margin of safety work as a buy trigger?
The margin of safety is a buffer below intrinsic value that protects against model error; a common rule is to buy only when the market price is meaningfully below the DCF-derived intrinsic value estimate.
How many trades do you need to validate a backtest?
Aim for 200 or more trades across varied market regimes; backtests with fewer than 100 trades are generally considered statistical noise and insufficient for drawing reliable conclusions.
What metrics matter most when evaluating a strategy?
The Sharpe ratio (target above 0.6), maximum drawdown (below 30% for aggressive long-term strategies), and expectancy (average profit per trade) are the three most informative metrics for assessing risk-adjusted performance.
How does Tickerplace help implement valuation-based trading rules?
Tickerplace provides daily DCF, P/E, and P/S fair-value estimates for 10,000+ equities, along with an intrinsic value calculator and margin-of-safety tools that translate model outputs directly into buy and sell triggers.