
ETF holdings analysis is the process of looking through a fund's wrapper to identify every underlying stock, bond, or asset it holds, so you can measure your true combined exposure rather than the exposure the fund's name implies. The first action to take is not research. It's arithmetic: calculate how much your ETFs overlap with each other and what you're paying in weighted average expense ratio across the whole portfolio. Both numbers are usually worse than investors expect.
MoneySmart frames this as core diversification hygiene, and Tickerplace's own valuation tools are built to extend that same look-through logic down to the individual stocks sitting inside your funds.
Before going further, run this quick check:
- List every ETF you hold with its dollar allocation.
- Pull each fund's top 10 holdings from the issuer's factsheet.
- Flag any stock appearing in more than one fund.
- Add up each fund's expense ratio, weighted by your allocation.
Key Takeaways
Overlap percentage and weighted average expense ratio are the two numbers every ETF holdings analysis should surface first, because both hide inside individual fund factsheets that look fine in isolation.
| Point | Details |
|---|---|
| Check overlap first | Aim to investigate consolidation once shared holdings across ETFs exceed roughly 20% to 30% of portfolio weight. |
| Watch single-stock concentration | Flag any stock representing more than 5% to 10% of your combined portfolio across all funds. |
| Calculate blended fees | Weight each fund's expense ratio by allocation to see the true cost, not the lowest listed fee. |
| Match replication methods | Compare physical ETFs to physical ETFs; synthetic funds hold collateral, not the index basket itself. |
| Add valuation context | Use Tickerplace's daily intrinsic value estimates to judge whether concentrated holdings are over- or undervalued. |
Where to Verify the Numbers Yourself
MoneySmart's diversification guidance is a solid starting point for official principles, and cross-checking your fund's own issuer disclosure page confirms holdings accuracy. For fee-drag mechanics, the analysis on ETF fee impact and general diversification explainers fill in the broader context.
What Tools For ETF Holdings Analysis Actually Do
A holdings analysis tool takes fund-level data and breaks it into something you can act on. Most competent tools share a core feature set: a look-through engine that unpacks each ETF into its underlying constituents, an overlap matrix comparing two or more funds side by side, sector and geography charts, a weighted expense ratio calculator, and some form of stress test or historical drawdown simulation. Portfolio x-ray tools go a step further and recursively unpack ETFs that themselves hold other ETFs, which is common in multi-asset and fund-of-funds structures.
DIY retail investors generally need three things working well: an accurate overlap matrix, a fee drag calculator, and a sector breakdown that updates without a two-week lag. Professional workflows tend to layer on stress testing, factor exposure, and currency attribution, since institutional mandates often require documenting risk beyond simple overlap percentages.
The single biggest trust signal in any tool is its data source. Holdings pulled directly from issuer disclosures, updated daily, are worth more than holdings scraped or estimated on a quarterly cycle, because issuer disclosure frequency materially affects confidence in the resulting weights.
Pro Tip: Before trusting any overlap number, check the "as of" date on the underlying holdings. A tool showing March data in June is giving you a snapshot of a portfolio that may no longer exist.
How Do You Run an ETF Holdings Analysis?
The workflow is the same whether you're checking two funds or twelve. Only the amount of manual reconciliation changes.
- List your tickers and allocations. Write down each ETF, its dollar value, and its percentage of your total portfolio.
- Confirm the holdings source. Use issuer factsheets or a tool that discloses where its data comes from, and check the update date.
- Run the look-through. Aggregate every underlying stock or bond across all your funds and compute each one's combined weight in your total portfolio.
- Calculate overlap. Compare pairs of ETFs (or the full set at once) to see what percentage of assets they share.
- Compute weighted average expense ratio. Multiply each fund's expense ratio by its portfolio weight, then sum the results.
- Run a stress test. Check historical beta and drawdown behavior against a benchmark like the S&P 500 or ASX 200 to see how the combined portfolio would have behaved in a downturn.
Step 5 deserves extra attention because fee drag is routinely underestimated. Tools that model this fee drag over multi-decade horizons tend to be the ones that actually change investor behavior, prompting consolidation of redundant funds rather than passive acceptance.
Six Metrics That Define an ETF Holdings Analysis
A useful holdings analysis, according to the diversification framework MoneySmart outlines, examines six dimensions rather than one. Skipping any of them leaves a blind spot.
- Holdings overlap percentage. Below 15% is usually fine. Between 20% and 30% deserves a closer look, and above that range, practitioners generally treat it as a signal to investigate consolidation, depending on your risk tolerance.
- Single-stock concentration. If one company represents more than 5% to 10% of your combined portfolio across all funds, you're carrying single-stock risk you may not have intended.
- Sector and geographic exposure. Compare your combined exposure against your target allocation, not against any one fund's stated mandate.
- Weighted average expense ratio. The blended cost of everything you hold, not the average of the listed fees.
- Portfolio risk metrics. Beta relative to a benchmark, historical volatility, and how the mix performed in past drawdowns.
- Diversification score. A composite that weighs overlap, sector spread, and geography together rather than in isolation.
The concentration threshold matters more than most investors assume. Overlap analysis frequently reveals that a handful of mega-cap stocks quietly dominate a portfolio an investor believed was well spread across multiple funds. Two broad-market ETFs from different issuers can still both be anchored by the same five or six technology names.
A Practical Walkthrough for Reviewing Your Holdings
Once you're inside a holdings analysis tool, the screens worth trusting are limited, and the ones worth double checking are predictable.
Start with the holdings source screen. Confirm whether the data comes from issuer disclosures and how recently it was refreshed. Currency handling matters here too. A US-domiciled ETF holding European equities may report in US dollars, and a tool that doesn't reconcile that properly will misstate your true exposure.

Next, open the overlap matrix and use it to decide what to consolidate.
Three mistakes show up constantly during this kind of review:
- Double-counting a stock because it appears in both a broad index fund and a sector fund without adjusting for the overlap.
- Ignoring fee drag because each individual expense ratio "looks small."
- Trusting stale holdings data on a fund that rebalances frequently.
Pro Tip: Run the same holdings analysis every time you add a new ETF, not just once a year. A single new fund can shift your overlap and sector numbers more than you'd expect.
How Tickerplace Extends Your Holdings Analysis
Once you've identified the overlap and concentration issues in your ETFs, the next useful step is valuing the individual stocks driving that concentration. Tickerplace provides daily updated valuation data across more than 10,000 US and ASX-listed equities, using DCF, P/E, and P/S models to estimate intrinsic value.
That matters directly for holdings analysis: if your look-through shows a single stock representing 8% of your combined portfolio, checking whether that stock is overvalued or undervalued tells you whether the concentration is a risk worth trimming or a position worth holding through.
Practical ways to combine the two:
- After running overlap analysis, pull intrinsic value estimates for your top five combined holdings.
- Use the intrinsic value calculator to stress-test assumptions on names carrying outsized weight.
- Browse the ETF catalog to confirm fund facts before comparing allocations.
Liquidity and Trading Volume of the Underlying Holdings
An ETF's own trading volume tells you almost nothing about whether you can exit it cheaply in a stressed market. What matters is the liquidity of the assets sitting inside it.
A fund holding large-cap, high-volume stocks can generally be created and redeemed efficiently, keeping the ETF's market price tight to its net asset value even during volatile sessions. A fund holding small-cap stocks, emerging-market bonds, or thinly traded niche assets carries a different risk profile. Authorized participants may struggle to source or offload the underlying securities without moving prices, which widens bid-ask spreads on the ETF itself, particularly during periods of market stress.
This is worth checking specifically for thematic and sector ETFs, which often bundle a handful of liquid mega-caps with a long tail of small, illiquid names. The headline holding might be a $2 trillion company. The 30th holding might trade a few hundred thousand dollars a day. Your holdings analysis should flag that tail, not just the top ten names shown on a factsheet summary.
Bond ETFs deserve the same scrutiny. Corporate and high-yield bond funds hold instruments that may not trade for days at a time, and during a credit market shock, that illiquidity can cause the ETF's price to diverge meaningfully from its stated net asset value before eventually converging again.
Physical vs Synthetic Replication and What It Means for Your Analysis
An ETF's replication method changes what "holdings" even means, which makes it a direct input into any holdings analysis.
Physically replicated ETFs hold the actual underlying securities, either the full basket (full replication) or a representative sample (sampling). When you look through a physical ETF, the holdings list reflects real, directly owned assets, and overlap calculations against other physical funds are straightforward.
Synthetically replicated ETFs use derivatives, typically a total return swap with a counterparty bank, to deliver the index's return without owning the underlying securities directly. The fund instead holds collateral, which may look nothing like the index it tracks. Running a standard look-through on a synthetic ETF and comparing it against a physical fund's holdings will produce a misleading overlap figure, because you're comparing a collateral basket to an actual equity basket.
Synthetic structures introduce counterparty risk that physical replication doesn't carry. If the swap counterparty defaults, the fund's ability to deliver the index return depends on collateral quality and legal protections, an added layer worth understanding before treating a synthetic ETF as functionally identical to a physical one in your portfolio.
Before running overlap analysis across multiple funds, confirm each one's replication method. Mixing physical and synthetic funds in the same overlap matrix without accounting for the difference will understate or overstate your real duplication risk.
Tracking Error and What It Reveals About Fund Quality
Tracking error measures how consistently an ETF's returns follow its benchmark index, expressed as the standard deviation of the difference between fund returns and index returns over time. It's distinct from tracking difference, which is simply the total return gap over a period.
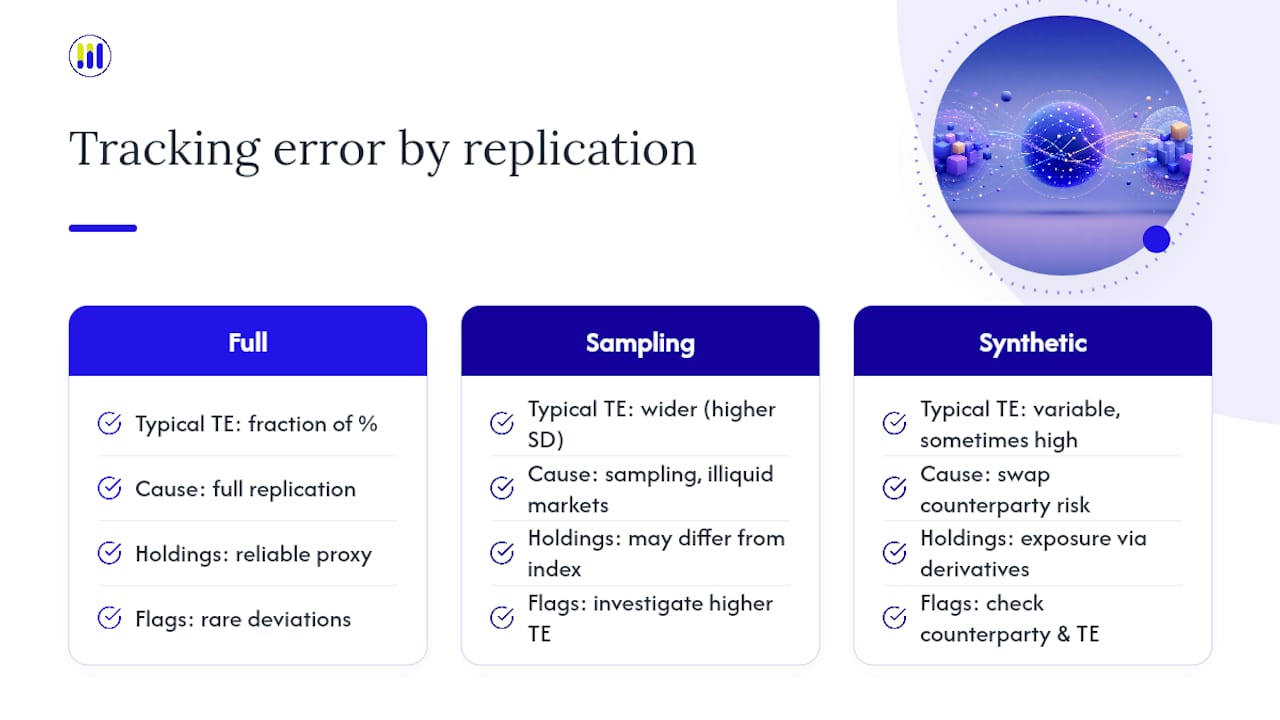
A well-run index fund with low costs and full replication typically shows tight tracking error, often a fraction of a percentage point annually. Wider tracking error tends to show up in funds using sampling rather than full replication, funds tracking illiquid or hard-to-access markets like frontier equities, and funds with higher turnover from frequent rebalancing.
For holdings analysis, tracking error is a quality check on whether a fund is doing what its factsheet claims. Two ETFs tracking the same index should behave almost identically. If one shows meaningfully higher tracking error than a comparable peer, that's worth investigating before treating the fund's holdings data as a reliable proxy for the index itself. It can also signal a fund manager taking liberties with sampling that widen the gap between stated exposure and actual exposure, which matters when you're relying on holdings data to calculate overlap and concentration.
Tracking error compounds over holding periods, so a small annual deviation can meaningfully separate a fund's actual return from its benchmark over five or ten years.
Dividend Yield and Distribution Timing Across Your Holdings
Every underlying holding in an ETF contributes to the fund's blended dividend yield, and that blend can look very different from any single stock's yield in isolation. A fund holding a mix of high-yield financials and zero-dividend growth stocks will report a yield that reflects neither extreme.
Distribution schedules vary by issuer and fund structure. Some ETFs distribute quarterly, others semi-annually or annually, and a few pass through income more frequently. This matters for two practical reasons. First, if you're relying on ETF income for cash flow, mismatched distribution timing across multiple funds can create uneven months. Second, holdings analysis should separate yield that comes from sustainable underlying dividend payers versus yield inflated by a handful of high-payout names that dominate the fund's income contribution.
Checking the top dividend contributors within a fund, not just the blended headline yield, tells you whether that income is diversified across many payers or concentrated in a few. Look-through data should show you which underlying names are actually driving the distribution, so you can judge whether that yield is likely to persist.
Tax Considerations Tied to ETF Holdings
Holdings analysis has a tax dimension that's easy to overlook until distribution season arrives. Because ETF structures pass through income and capital gains to unit holders, what's inside the fund directly shapes your tax outcome, not just your return.
Funds with high internal turnover, meaning the manager frequently buys and sells underlying holdings to track the index or manage sampling, tend to realize more capital gains internally. Those gains get distributed to investors as taxable events even if you never sold a unit yourself. A low-turnover, fully replicated index fund typically generates fewer of these internal taxable events than a fund using frequent rebalancing or a narrower thematic mandate.
Distribution composition also matters. Some payouts include franking credits on Australian equity income, some include foreign income with associated foreign tax offsets, and some include a return of capital component that isn't taxed as income at all. These categories are disclosed in the fund's annual tax statement, and they can differ substantially between two ETFs that otherwise look similar on a factsheet.
Because tax treatment depends on your personal residency, income bracket, and the specific structure of each fund, holdings analysis can flag where tax complexity is likely to arise, but it can't substitute for a conversation with a tax professional or adviser who can apply these details to your situation. Treat this section as a prompt to ask better questions, not as a substitute for that advice.
When Should Holdings Analysis Trigger a Portfolio Change?
Most reviews end in one of three outcomes: consolidating overlapping funds, rebalancing a sector that's drifted from target, or trimming a single stock that's grown outsized through overlap. Small, mechanical adjustments like these are reasonable to make yourself. Larger structural changes, especially anything with meaningful tax consequences, deserve a licensed adviser's input. Tickerplace's valuation tools are useful for the analysis; they're not a substitute for that conversation.
— Tickerplace
Tickerplace Can Help You Value What's Inside Your ETFs
Overlap percentages and expense ratios tell you where your risk is concentrated. They don't tell you whether the stocks causing that concentration are worth holding at current prices. That's the layer Tickerplace adds on top of a standard holdings analysis.

Tickerplace is free to use and covers more than 10,000 US and ASX-listed companies, generating daily intrinsic value estimates using DCF, P/E, and P/S models. It's built for individual investors who want institutional-grade valuation without paying institutional prices, which fits naturally with the DIY approach most retail holdings analysis already assumes. If your overlap check flags a stock dominating two or three of your ETFs, run it through the stock valuation calculator to see whether that concentration is currently a discount or a warning sign. Check your top overlap holdings today and see where the fair value estimates land.
Sources
- MoneySmart — Diversification guidance
- Stockspot — Vanguard ETF analysis and commentary
- Fixed Income News — commentary on ETF fees and impact
FAQ
What is ETF holdings analysis?
It's the process of looking through an ETF's structure to identify its actual underlying assets, so you can calculate your true combined exposure across every fund you hold.
What is fee drag in an ETF portfolio?
Fee drag is the cumulative cost of blended expense ratios across all your funds, calculated as a weighted average, and it compounds meaningfully over 10 to 30 year holding periods.
Does replication method affect holdings analysis?
Yes. Physical ETFs hold real underlying securities, while synthetic ETFs hold collateral backing a swap, so comparing their look-through holdings directly can produce misleading overlap figures.
Can Tickerplace help with ETF holdings analysis?
Tickerplace doesn't run overlap matrices directly, but its daily intrinsic value estimates for over 10,000 US and ASX-listed stocks let you evaluate whether concentrated holdings uncovered by a look-through are fairly priced.