
Start every ETF analysis with a screener, not a fund fact sheet. Filter the universe by role and cost first, then move into the fund's holdings, tracking history, and liquidity before it earns a place in your portfolio. Anchor the deep dive to expense ratio, tracking difference, and Australian and US screener tools like the ones covered below, and revisit the position quarterly or whenever the fund drifts from its stated role.
TL;DR:
- Using a screener to filter ETFs by expense ratio, AUM, domicile, and liquidity is essential before diving into detailed fund analysis.
- Tracking difference and tracking error over multiple years provide a clearer picture of a fund’s long-term index replication performance.
- Conducting overlap checks and monitoring concentration in top holdings help prevent unintended risk clustering in a core-satellite portfolio.
- Domicile, issuer credibility, and fund structure (physical vs synthetic) significantly influence an ETF’s operational reliability and underlying risk.
- Pairing fund screening with stock valuation tools offers a more comprehensive assessment of whether an ETF's top holdings are fairly valued.
What ETF Analysis Tools Actually Do
Four tool categories cover most of the workflow, and mixing them up wastes time. A screener narrows thousands of funds down to a short candidate list using filters like expense ratio, asset class, and issuer, similar to what Etf offers across its fund universe. A holdings analyzer goes one level deeper, showing you exactly what sits inside the fund and how much overlaps with what you already own. A backtester shows how a strategy or fund would have performed across past market cycles, useful for stress testing but never a guarantee of future returns. A portfolio builder ties individual ETF picks together, checking that allocations still match your target risk profile.
- Screeners: filter by expense ratio, AUM, sector, and replication method
- Holdings analyzers: reveal top holdings, sector weights, and geographic exposure
- Backtesters: simulate historical performance under different market conditions
- Portfolio builders: check aggregate allocation and flag overlap across funds
For Australian investors, accurate ASX coverage matters as much as US data. A tool with thin ASX listings or stale pricing on local funds will leave gaps exactly where you need the most clarity.
The Metrics That Actually Predict ETF Performance
Cost is the most visible number on any fund page, but it is not the whole cost. The expense ratio, or TER, covers the fund's stated management fee, yet total cost of ownership also includes the bid-ask spread you pay on every trade and any tracking slippage the fund racks up against its benchmark.
Liquidity comes next. Average daily volume and bid-ask spread tell you how expensive it is to get in and out, particularly for larger trades or less popular funds. Low AUM funds often carry wider spreads and face a higher risk of closure.
Tracking difference and tracking error deserve separate attention because they measure different things entirely. Tracking difference is the cumulative performance gap between the fund and its benchmark over a set period, while tracking error measures how much that gap bounces around over time. A fund can post a small average tracking difference while still carrying a jumpy tracking error, which signals inconsistent index replication.
A single year of tracking data rarely tells the full story. Check tracking difference across three- and five-year windows, not just the most recent twelve months, since one calm year can mask a fund that struggles during volatile stretches.
Round out the checklist with holdings concentration (how much sits in the top 10 names), volatility, maximum drawdown, and Sharpe ratio, which together describe how bumpy the ride has been relative to the return delivered.
A Repeatable ETF Analysis Workflow You Can Run Today
Treat ETF analysis as a sequence, not a single lookup. Skipping steps is how investors end up holding three "different" ETFs, all owning the same 20 mega-cap stocks.
- Define the role first. Decide whether this fund is a core holding meant to anchor your portfolio or a satellite position meant to express a tactical view, then set your universe and screening filters accordingly.
- Build a shortlist. Run your screener with those filters and export the candidate list, including ticker, TER, AUM, and category, so you can compare on a level footing.
- Deep-dive the finalists. Pull the factsheet for each shortlisted fund, check top-10 holdings, verify tracking difference across multiple years, and note the average bid-ask spread.
- Run a simple scenario check. Ask how the fund likely behaves in a sharp drawdown or a sector rotation, based on its historical volatility and sector concentration.
- Decide sizing and integrate. Size the position based on its role, check it against existing holdings for overlap, and add it to your portfolio tracker.
- Set a monitoring cadence. Commit to a quarterly check-in and an annual deep review, rather than reacting to every headline.
Pro Tip: Export your screener results to a spreadsheet before you get attached to any single fund. Seeing five candidates side by side on the same columns makes weak performers and hidden fee drag obvious in a way that browsing one fund page at a time never does.
Overlap, Allocation, and When to Rebalance
A core-satellite structure keeps the analysis clean: broad, low-cost funds anchor the portfolio, and smaller tactical or thematic positions sit around the edges. The problem most investors hit is overlap. Two ETFs with different names and different issuers can still hold nearly identical top constituents, which quietly concentrates risk rather than spreading it.
- Run a holdings overlap check whenever you add a new fund to an existing portfolio
- Review the full portfolio quarterly and do a deeper annual review against your original allocation targets
- Rebalance on a rule, such as a percentage drift threshold, rather than reacting to headlines
Pro Tip: *Write your rebalancing rule down before you need it.
The Field-by-Field ETF Evaluation Checklist
Keep this list in a spreadsheet and fill it in the same way for every fund you consider. Consistency here is what makes comparisons meaningful.
- Ticker, issuer, and domicile — from the fund factsheet
- TER (expense ratio) — factsheet or screener
- AUM and average daily volume — screener or exchange data
- Bid-ask spread — live quote or broker platform
- Replication method (physical or synthetic) — factsheet
- Top 10 holdings percentage — holdings download
- Tracking difference over 1, 3, and 5 years — factsheet or issuer reporting
- Historical volatility and maximum drawdown — screener analytics
| Field | Quick pass/fail heuristic |
|---|---|
| TER | Under 0.30% for broad core funds is a reasonable starting bar |
| AUM | Below roughly $50 million raises closure risk |
| Bid-ask spread | Wider than 0.20% on a liquid asset class is a caution flag |
| Top 10 holdings % | Above 60% suggests limited diversification benefit |
Why ETF Tax Efficiency Changes the Math
ETFs are frequently sold on tax efficiency, and the structural reason holds up: the in-kind creation and redemption process most ETFs use lets authorized participants exchange baskets of securities rather than cash, which tends to minimize the capital gains distributions that mutual fund holders often get stuck with even in years the fund lost money. That structural advantage is real, but it is not universal or automatic.
For Australian investors, the practical tax picture depends on the specific fund's structure, its domicile, and your own circumstances, so Moneysmart's overview is a sound starting reference for the basics before you assume a given fund behaves like a US-domiciled equivalent. Distributions, franking credits on Australian equity ETFs, and treatment of international ETFs all affect the after-tax return you actually keep, and none of that shows up in a headline expense ratio.
This is where ETF analysis has to extend past performance charts. Two funds tracking the same index can produce different after-tax outcomes depending on how often they trade underlying holdings, how they handle dividend distributions, and where they are domiciled. Turnover matters here too. A fund with high internal turnover, common in some smart-beta and thematic strategies, generates more taxable events than a plain-vanilla index tracker even when both carry a similar TER. Factor tax treatment into your comparison alongside cost and tracking, not as an afterthought once you've already decided.
Matching ETF Strategies to the Job You Need Done
Not every ETF in your portfolio should be doing the same job, and confusing the strategies is a common source of disappointing returns.
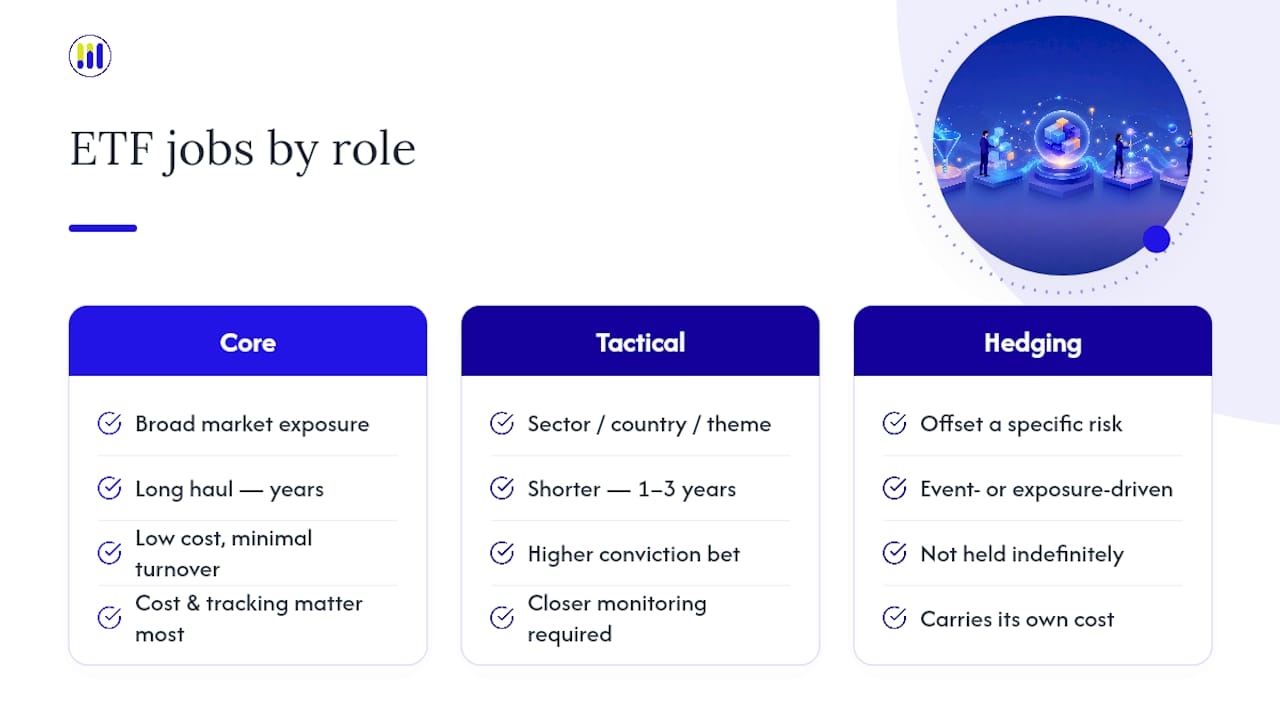
A core holding is built for the long haul: broad market exposure, low cost, and minimal turnover, designed to sit largely untouched for years. This is where the bulk of a buy-and-hold portfolio typically lives, and it's the position where cost and tracking efficiency matter most because you're compounding through them for a long time.
A tactical allocation is a shorter-term, higher-conviction bet, maybe a sector, a country, or a theme you expect to outperform over the next one to three years. These positions warrant closer monitoring and a clearer exit plan, since the thesis behind them has a shelf life the core holding doesn't.
Hedging uses ETFs to offset a specific risk elsewhere in the portfolio, such as an inverse or currency-hedged fund used to dampen volatility around a known event or exposure. This is a specialized use case and generally not something to hold indefinitely, since hedges carry a cost of their own and work against you when the risk they're covering doesn't materialize.
VanEck's guidance on ETF strategy reinforces a point worth repeating: dollar-cost averaging and sector rotation both show up as popular approaches, but each still needs a scheduled review built in. None of these strategies runs well on autopilot, and mixing up a tactical fund's risk profile with a core holding's is one of the more common portfolio design mistakes.
Checking Who Actually Stands Behind the Fund
The issuer matters more than most investors give it credit for, especially once you move past the largest, most liquid funds. A fund's structure, its replication approach, and even its long-term survival odds trace back to the sponsor running it.
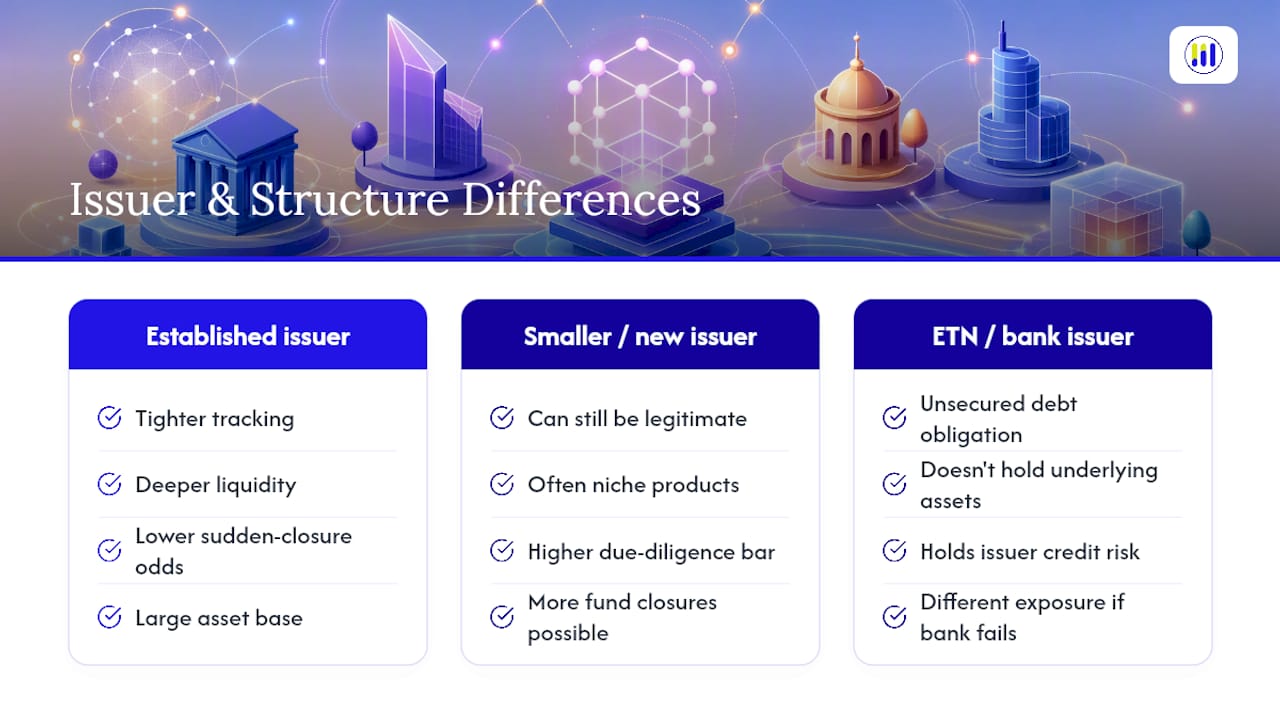
Established issuers with deep asset bases across many funds tend to offer tighter tracking, deeper liquidity, and lower odds of an abrupt fund closure, simply because they have the infrastructure and scale to run index replication efficiently. Smaller or newer issuers can still offer legitimate, well-run funds, particularly in niche categories where larger issuers haven't built a product, but the due diligence bar goes up. Check how long the issuer has run similar strategies, how many other funds they've closed, and whether their reporting and factsheet transparency match what larger competitors provide.
Domicile and structure sit alongside sponsor credibility. A physically replicating fund holds the actual underlying securities, while a synthetic fund uses derivatives, typically swaps, to deliver the index return, which introduces counterparty risk that a physical structure doesn't carry. It's also worth understanding the distinction between an ETF and an exchange-traded note, or ETN, since an ETN is technically an unsecured debt obligation of the issuing bank rather than a fund holding assets, which changes your risk exposure if that issuer runs into financial trouble. None of this shows up in a performance chart, but it shapes what you're actually exposed to when you buy the ticker.
Tickerplace's Take on Running This Workflow
The platform's screener, watchlists, and comparison tools support this workflow: filtering a universe of listed funds, flagging candidates for a holdings check, and using valuation tools on underlying equities when an ETF's top holdings warrant a closer look. The platform won't replace a factsheet, but it removes the friction of jumping between five different sites just to build a shortlist worth deep-diving.
— Tickerplace
Put the Screener-First Workflow to Work
There are free ways for Australian and US investors to run the early stages of this workflow without paying for institutional-grade software. Start by browsing the list of ETFs by market cap to build your candidate universe, then use the stock valuation checker or intrinsic value calculator to assess whether a fund's top holdings are trading above or below fair value before you commit capital.

This matters because an ETF's price only tells you what the market is paying today, not whether the underlying businesses justify it. Pairing fund-level screening with stock-level valuation gives you a fuller picture than checking expense ratios alone. Head to Tickerplace's platform to run your own shortlist against these tools and see how your current holdings stack up before your next portfolio review.
This article is general information, not a substitute for advice from a qualified financial advisor. Consult a qualified financial professional about your own circumstances before acting on anything here.
Sources
A screener is only as useful as the filters you apply to it. Databases like ETF Database let you filter and compare funds across expenses, liquidity, and volatility, but the filters that carry the most signal for most investors are TER, AUM, domicile, replication method, and average daily volume. Set minimum thresholds for AUM and volume early, since funds below a reasonable size or trading level introduce closure and spread risk you probably don't want to underwrite.
Once you have a shortlist, validate it against the fund's own factsheet and holdings download rather than relying solely on the screener's summary numbers, which can lag. Check top-10 weight specifically.
FAQ
How Do You Analyze an ETF?
Start with a screener to filter by role and cost, then check the fund's holdings, expense ratio, tracking difference, and liquidity before deciding whether it fits your portfolio, reviewing the position on a quarterly cadence afterward.
What Did Warren Buffett Say About ETFs?
Buffett has publicly recommended low-cost, broad-market index funds for most individual investors, arguing that a simple, diversified approach beats trying to pick individual winners over the long run.
What Is the Best Site for Analyzing ETFs?
No single site covers every need. Dedicated screeners like ETF.com and ETF Database handle fund-level filtering well, while a platform like Tickerplace adds value when you need to evaluate the individual stocks sitting inside a fund's top holdings.