
Earnings quality analysis tests whether reported profit is recurring, cash-supported, and decision-useful, not simply a headline number. The core question is always the same: does net income reflect sustainable operating performance, or is it inflated by accounting choices, one-off gains, and accruals that will reverse? Analysts run this check before trusting reported earnings in a valuation model or a deal negotiation. The sections below lay out the metrics, the checklist, and the tools that make that judgment repeatable.
TL;DR:
- A cash conversion ratio consistently above 1.0 over multiple years indicates cash-backed earnings, while a declining ratio signals potential quality issues.
- High accruals relative to assets often predict earnings volatility and reduce the likelihood of recurring profits.
- Discrepancies between rising net income and declining or flat operating cash flow are key warning signs of low earnings quality.
- A formal Quality of Earnings report rigorously tests add-backs, revenue sources, and cash conversion to normalize EBITDA for deal purposes.
- Focusing only on small accrual adjustments wastes resources; prioritizing large-dollar items significantly affects valuation outcomes.
What Earnings Quality Means Beyond the Headline Number
Earnings quality refers to how closely reported profit tracks actual cash generation and reflects performance an analyst can reasonably expect to recur. High-quality earnings are recurring, persistent, and cash-supported, while low-quality earnings lean on one-time items, aggressive estimates, or accounting maneuvers that flatter the current period at the expense of the next one.
Two related but distinct ideas sit inside this concept:
- Reporting quality asks whether the financial statements faithfully represent what actually happened at the company.
- Results quality asks whether the underlying economic performance itself is good, separate from how well it was reported.
A company can report faithfully and still post weak, unsustainable results. It can also post strong current results built on reporting choices that won't hold up. A useful early warning sign: net income climbs while operating cash flow flattens or falls. That gap, more than any single ratio, is what pulls an analyst into deeper diagnostic work.
Core Metrics and Ratios for Measuring Earnings Quality
A handful of earnings quality metrics do most of the diagnostic work, and they're worth running as a standard first pass on any company under review.
- Cash conversion ratio (operating cash flow divided by net income). A ratio persistently below 1.0 signals that reported profit isn't showing up in the bank.
- Total accruals to total assets, often called the Sloan ratio, measures the gap between accrual accounting and cash accounting. Higher accrual intensity tends to predict faster mean reversion in earnings, which is another way of saying accrual-heavy profits are less likely to repeat.
- Days sales outstanding and inventory turnover flag revenue or cost items sitting on the balance sheet longer than the business cycle justifies.
- Gross margin trend analysis catches quiet shifts in pricing power or cost absorption that a single-period look would miss.
- EBITDA reconciliation traces every adjustment back to the income statement line it modifies.
Quick reference: cash conversion ratio = operating cash flow ÷ net income. A result comfortably above 1.0 across multiple years is a strong signal of cash-backed earnings; a result trending toward zero or negative deserves immediate follow-up. Valuation work leans hardest on persistence and comparability; credit analysis leans harder on cash conversion and realistic leverage capacity, since a lender cares less about growth potential than about whether cash actually clears each period.
How QoE Reports Normalize Earnings in M&A Due Diligence
A formal Quality of Earnings report is the concentrated version of everything above, built for a specific transaction rather than a general check-up. QoE engagements evaluate financial performance, proof of cash, net working capital, and non-recurring items to normalize EBITDA into a defensible, sustainable figure. Scope isn't standardized, but most engagements follow a similar sequence.
- Start with reported EBITDA and list every proposed add-back the seller or management wants included.
- Test each add-back against contracts, recurring invoices, payroll records, and bank statements rather than accepting a management assertion at face value.
- Trace revenue quality: customer concentration, contract renewal patterns, and whether growth is organic or acquired.
- Normalize net working capital by removing seasonal swings and confirming a defensible run-rate target.
- Trace cash: confirm reported profit actually converts to bank deposits over the review period, not just on paper.
Owner-related add-backs deserve particular scrutiny. Corroborating them with contracts, recurring invoices, payroll records, and bank cash traces is standard practice, since a "one-time" personal expense that shows up every year isn't one-time at all.
A Step-by-Step Earnings Quality Analysis Checklist
Running earnings quality analysis in a repeatable order keeps the work from turning into an unstructured hunt through the footnotes. Here's a sequence that works for most engagements, whether the goal is a standalone valuation or a transaction.
- Define the objective. Valuation, refinancing, and acquisition due diligence each call for different depth and different adjustments.
- Build an EBITDA bridge. List every candidate add-back separately so each one can be tested and defended or rejected on its own merits.
- Trace the income statement to cash. Confirm that reported profit shows up in operating cash flow and, ultimately, in the bank. This income-statement-to-cash-flow trace is the core mechanical test for earnings quality.
- Examine working capital and capital expenditures. Confirm NWC reflects a normal operating cycle and capex isn't understated to flatter free cash flow.
- Review accounting policies and estimates. Flag any change in revenue recognition, depreciation schedules, or reserve methodology between periods.
- Check related-party transactions. These often hide non-arm's-length pricing that inflates or depresses reported results.
- Prioritize findings by materiality. The CFA Institute's own framework for evaluating financial report quality stresses ranking issues by dollar impact before converting them into valuation or deal adjustments.
Pro Tip: Don't chase every accounting quirk equally. A $50,000 add-back on a company valued at $200 million barely moves the needle, but a $2 million revenue recognition shift can swing the entire multiple. Spend your time where the dollars are.
Red Flags That Signal Weak Earnings Quality
Certain patterns show up again and again in companies with genuine earnings quality problems, and they're worth checking as a matter of routine rather than waiting for suspicion to build.
- Net income rises for two or more consecutive periods while operating cash flow stays flat or declines, a discrepancy Investopedia identifies as one of the clearest warning signs of low earnings quality.
- Recurring "one-off" or "non-recurring" charges that show up in nearly every reporting period.
- A sudden change in accounting policy, particularly around revenue recognition or cost capitalization, without a clear business reason.
- Revenue that spikes disproportionately in the final days of a quarter.
- Heavy reliance on related-party transactions or a small number of customers for a large share of revenue.
None of these alone proves manipulation. Together, and especially when several appear at once, they justify a deeper look before the numbers go into a model.
Turning QoE Findings Into Valuation and Deal Terms
Earnings quality findings only matter if they change a number somewhere. A sound QoE analysis connects normalized earnings and persistence judgments directly to purchase price, leverage capacity, and negotiation levers, rather than sitting in a report as a list of observations.
- Adjust the base. If a portion of EBITDA depends on a customer contract expiring next year, strip it from the base used for multiples and terminal value.
- Reflect persistence in growth assumptions. Low-persistence earnings deserve a more conservative terminal growth rate in a discounted cash flow model, not just a lower current multiple.
- Translate findings into deal mechanics. Working capital shortfalls become closing adjustments; disputed add-backs become escrow or holdback terms; customer concentration risk often becomes an earnout structure rather than a straight cash payment.
Normalizing earnings without translating the result into a price, a covenant, or a discount rate leaves the analysis half-finished.
Using Tickerplace and Public Filings to Run the Checks
Applying this checklist doesn't require a Bloomberg terminal. Pulling a company's income statement, cash flow, and balance sheet on Tickerplace gives you the three statements needed for the net-income-to-cash trace in one place, updated daily across thousands of US and ASX-listed companies.
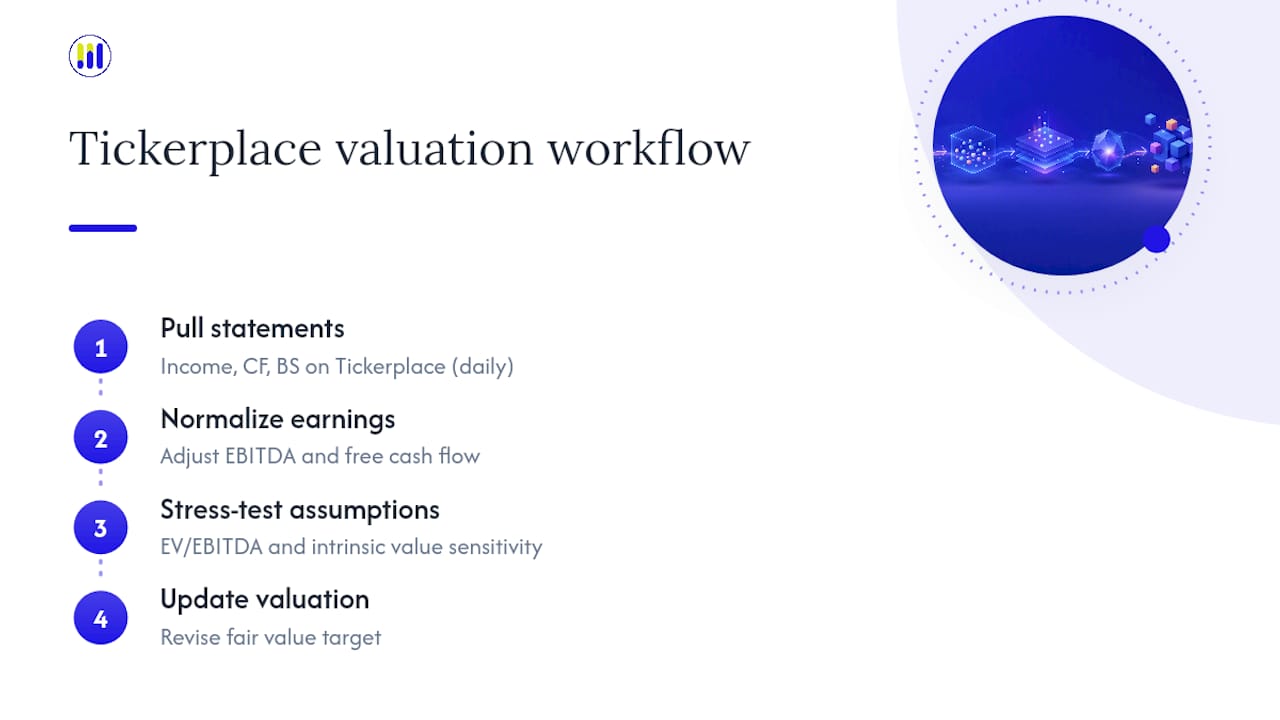
Once you've normalized EBITDA, run the adjusted figure through the EV/EBITDA calculator to see how the multiple shifts, then feed normalized free cash flow into an intrinsic value estimate to test how sensitive the fair value target is to your persistence assumptions. A practical workflow: pull the statements, normalize the earnings, stress-test the assumptions, then update the valuation. The investing education section covers the underlying ratios if any term needs a refresher along the way.
Why Discipline in Earnings Quality Analysis Changes Outcomes
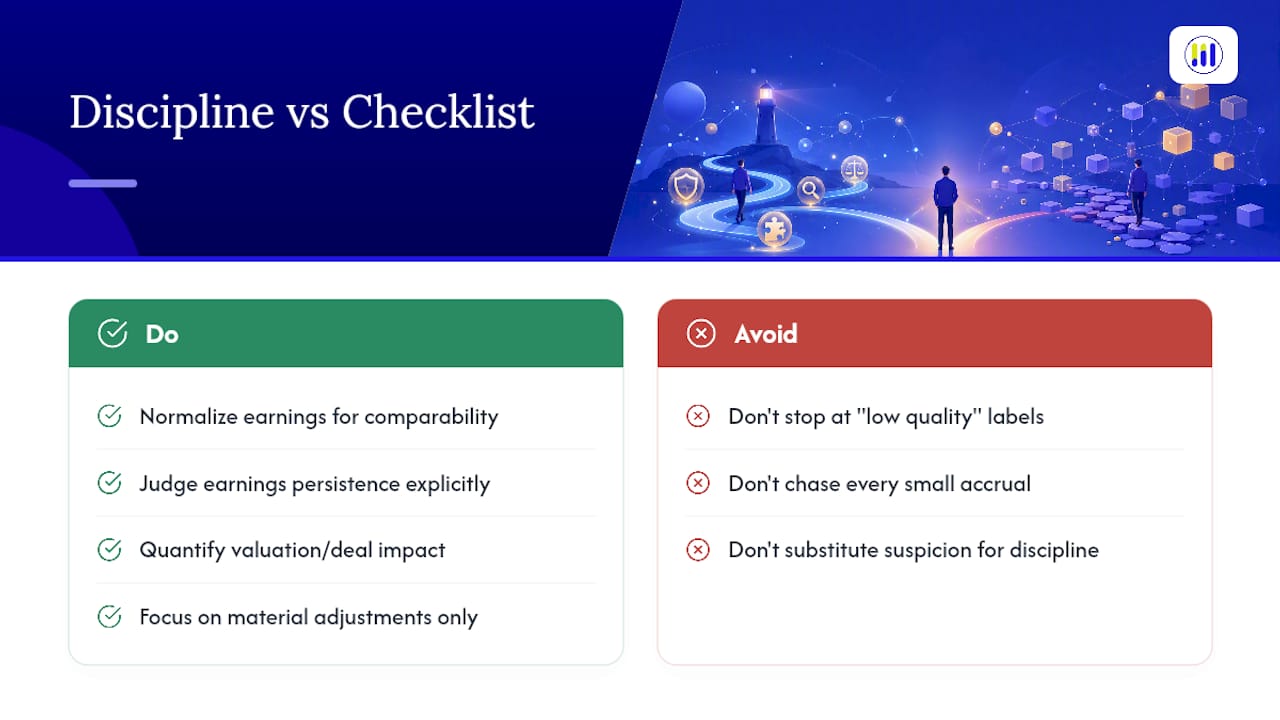
Too many reviews stop at labeling earnings "low quality" and move on. That's an incomplete job. The real analytical task is normalizing the earnings, judging persistence, and quantifying exactly how that changes the valuation or deal decision.
Materiality has to guide the effort. Chasing every small accrual wastes time better spent tracing the handful of adjustments that actually move a valuation. Good earnings quality analysis isn't about suspicion; it's about discipline applied where the dollars are largest.
— Tickerplace
Run the Numbers With Tickerplace's Free Valuation Toolkit
Building an EBITDA bridge by hand across spreadsheets is slow, and most retail-grade tools stop at reported figures without letting you stress-test what happens when earnings get normalized. Some platforms provide multi-model valuation approaches used in professional QoE work, including DCF, P/E, and P/S methods, built into free, regularly updated tools covering a broad range of US and ASX-listed companies.

Start with the intrinsic value calculator to see how adjusted free cash flow assumptions move a company's fair value target, then run the same ticker through the stock valuation checker to see whether the market price already reflects the earnings quality concerns you've found. Both tools are free to use right now at Tickerplace, no spreadsheet rebuild required.
This article is general information, not a substitute for advice from a qualified financial advisor. Consult a qualified financial professional about your own circumstances before acting on anything here.
Sources
- Earnings quality — learning from past cases (CFA Institute blog)
- How to Analyze the Quality of Earnings of a Business: A Complete Guide (Synpact Consulting)
- Quality of Earnings (Investopedia)
FAQ
How do you measure earnings quality?
Compare operating cash flow to net income, calculate total accruals relative to total assets, and check whether revenue and margin trends hold steady across multiple periods rather than spiking in isolated quarters.
What is a good earnings quality ratio?
A cash conversion ratio (operating cash flow divided by net income) consistently above one over multiple years signals strong earnings quality; a ratio trending downward toward zero or negative warrants a closer look at accruals and revenue recognition.
How do you calculate earnings quality?
There's no single formula. Analysts combine the cash conversion ratio, the accruals-to-assets measure, and a trace of net income through cash flow and the balance sheet to judge whether reported profit is recurring and cash-backed.
What is a QoE in M&A?
A Quality of Earnings report is a due-diligence exercise that normalizes a target company's EBITDA by testing add-backs, revenue quality, and net working capital, producing a sustainable earnings figure that buyers and lenders use to set price and deal terms.