
TL;DR:
- Accurate EPS calculation is crucial and requires careful verification of data and formulas.
- Diluted EPS accounts for potential share increases from options and convertibles, providing a fuller valuation view.
- Using advanced tools and cross-checking results helps avoid errors and gain deeper investment insights.
Mispricing a stock because of a flawed earnings per share calculation is a costly mistake that even experienced analysts make. EPS sits at the center of equity valuation, price-to-earnings ratios, and earnings growth analysis, yet many investors treat it as a simple number pulled from a report rather than a figure that demands careful verification. This guide walks you through every prerequisite, formula step, and advanced adjustment you need to calculate EPS accurately, and shows you how to use modern tools to confirm your results before they drive any investment decision.
Key Takeaways
| Point | Details |
|---|---|
| EPS inputs matter | Accurate calculation relies on correct net income, dividends, and share counts. |
| Use diluted EPS for complexity | Always assess dilution when options or convertibles are present in the capital structure. |
| Verify with calculators | Double-check manual EPS results with reliable calculators to avoid errors. |
| Watch for anti-dilutive effects | Exclude securities that inflate EPS to avoid misleading results. |
| EPS is not enough | Supplement EPS with other financial metrics for well-rounded stock evaluations. |
What you need before calculating EPS
Now that you've recognized how crucial EPS is to making sound investment choices, let's get set up with what you'll need. Before you touch a formula, you need the right data and a clear understanding of which EPS type fits your situation. Understanding what is EPS at a foundational level saves you from compounding errors later.
There are two primary forms: basic EPS and diluted EPS. Basic EPS uses only common shares currently outstanding. Diluted EPS expands the denominator to include all potential shares from stock options, warrants, and convertible securities. As a rule of thumb, prioritize diluted EPS for companies with complex capital structures; basic EPS is sufficient for simple ones.
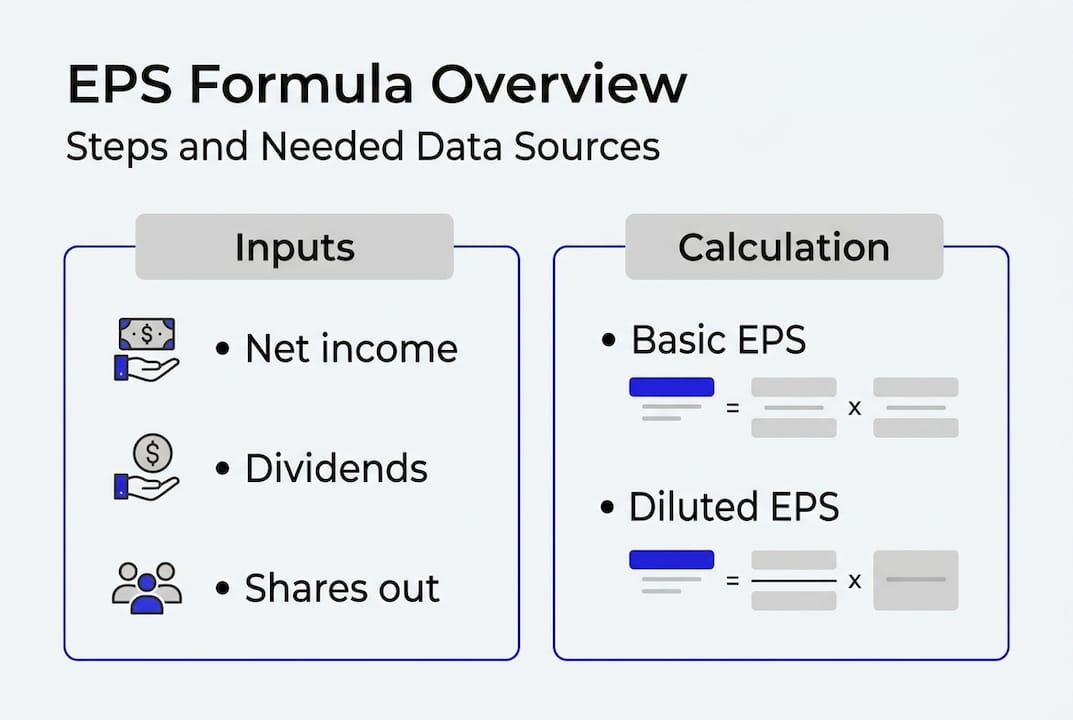
Here is the data you need and where to find it:
| Data Point | Description | Source |
|---|---|---|
| Net income | Bottom-line profit after taxes | Income statement |
| Preferred dividends | Dividends owed to preferred shareholders | Notes to financial statements |
| Weighted average shares | Average shares outstanding over the period | Income statement or 10-K filing |
| Dilutive securities | Options, warrants, convertible notes | Footnotes or equity schedule |
| Reporting period | Quarter or full fiscal year | SEC filings or earnings release |
Key inputs to gather before you start:
- Net income for the specific reporting period
- Declared preferred dividends (not paid, but declared)
- Weighted average common shares outstanding
- Details on any dilutive instruments in the capital structure
Pro Tip: Always verify you are using data from the same reporting period across all inputs. Mixing a quarterly net income figure with an annual share count is one of the most common errors analysts make.
You can streamline data entry and reduce manual errors by using the EPS calculator at Tickerplace, which guides you through each required field.
EPS formula explained: Step-by-step calculation
Once you've gathered all your data, it's time to see exactly how the EPS formula works. The standard formula is straightforward:
EPS = (Net Income – Preferred Dividends) / Weighted Average Shares Outstanding
Let's walk through a concrete example to make the math tangible:
- Net Income: $1,000,000
- Preferred Dividends: $100,000
- Weighted Average Shares Outstanding: 500,000
Step-by-step calculation:
- Subtract preferred dividends from net income: $1,000,000 – $100,000 = $900,000. This gives you earnings attributable to common shareholders.
- Confirm your share count: Ensure the 500,000 figure is the weighted average, not a snapshot from a single date.
- Divide: $900,000 / 500,000 = $1.80 EPS.
- Interpret: Each common share earned $1.80 during the period. Compare this to prior periods and peer companies to judge performance.
For diluted EPS, the numerator may increase (adding back interest on convertible debt) and the denominator grows to include incremental shares. The Treasury Stock Method assumes options are exercised, uses the proceeds to repurchase shares at the average market price, and adds the net incremental shares to the denominator.

Pro Tip: Use the EPS formula calculator to double-check your math before acting on results. Even a small data entry error can shift your EPS figure enough to change a buy or sell decision. The Financial Calculators Hub also offers complementary tools for cross-referencing your outputs.
Handling complex cases: Diluted EPS and special adjustments
The basic formula works for simple cases, but let's navigate the complexities when special securities enter the mix. Several instruments can expand the share count and reduce EPS, and each requires a distinct treatment.
| Feature | Basic EPS | Diluted EPS |
|---|---|---|
| Share count | Actual weighted average shares | Weighted average + potential shares |
| Numerator | Net income – preferred dividends | Adjusted for interest/dividends on convertibles |
| Complexity | Low | Moderate to high |
| Best used for | Simple capital structures | Companies with options, warrants, convertibles |
Situations that require diluted EPS calculations:
- The company has outstanding stock options or employee stock purchase plans
- Warrants are in the money relative to the average share price
- Convertible bonds or convertible preferred stock exist in the capital structure
- Restricted stock units are unvested but expected to vest
The If-Converted Method applies to convertible securities: assume they convert at the start of the period, add back after-tax interest (for convertible debt) or stop subtracting dividends (for convertible preferred), and add the conversion shares to the denominator. This is the standard treatment under U.S. GAAP.
Important: Anti-dilutive securities are always excluded from diluted EPS. If including a security would increase EPS rather than reduce it, it is anti-dilutive and must be left out. In net loss periods, most dilutive instruments become anti-dilutive and are therefore excluded, meaning basic and diluted EPS often equal each other. Watch for FASB dilution changes that may alter how loss scenarios are handled in future reporting standards.
Understanding EPS and capital structure together is essential for any analyst working with growth-stage companies that rely heavily on equity compensation.
Verifying your results and using calculators effectively
Mastering calculation methods is just part of the journey. Let's ensure your numbers are accurate and actionable. Manual calculations carry inherent risk, so a structured verification process is non-negotiable for serious analysts.
How to double-check your EPS calculation:
- Enter your inputs into the EPS calculator and compare the output to your manual result.
- If figures differ, recheck each data point: net income, preferred dividends, and share count.
- Confirm you are using the same reporting period for all inputs.
- Verify whether you calculated basic or diluted EPS and whether the calculator matches your method.
- Cross-reference your result with the EPS figure disclosed in the company's official earnings release.
Common missteps that distort EPS results:
- Omitting preferred dividends from the numerator adjustment
- Using period-end shares instead of the weighted average
- Including anti-dilutive securities that should be excluded
- Applying the wrong method (If-Converted vs. Treasury Stock) to a given security type
- Failing to adjust for stock splits or reverse splits within the reporting period
Pro Tip: Document every assumption you make during a calculation, including the source of each data point, the method applied, and the reporting period used. This creates an audit trail and makes it far easier to spot errors when your EPS figure diverges from published reports. Explore other financial calculators to build a complete verification workflow around your EPS analysis.
A smarter approach to EPS: Experience-based insights
After verifying your calculations, it's worth stepping back and considering how to use EPS wisely in the bigger picture. EPS is a powerful signal, but treating it as the final word on a company's value is a mistake that has cost investors dearly.
The gap between basic and diluted EPS is often where the real story hides. A company reporting strong headline EPS while quietly issuing millions of options is effectively transferring value away from existing shareholders. That dilution gap deserves as much scrutiny as the earnings figure itself.
Some of the most consequential investment errors stem from accepting reported EPS at face value without questioning the accounting choices behind it. Non-recurring items, changes in share buyback timing, and aggressive revenue recognition can all inflate the number. Cross-checking EPS in practice against free cash flow, return on equity, and revenue growth gives you a far more reliable picture.
Pro Tip: Never make a position decision based on EPS alone. Use it as one data point within a multi-metric framework that includes valuation ratios, balance sheet strength, and sector context.
Level up: Advanced tools to streamline your EPS analysis
Ready to put EPS in action with real investing? Streamline and expand your analysis with modern tools.
Manual EPS calculations are valuable for building intuition, but they slow you down at scale. Tickerplace gives you a purpose-built EPS calculator that handles both basic and diluted inputs, reducing errors and making your analysis repeatable across dozens of companies.

Once you have your EPS figures, the stock screener lets you filter equities by EPS growth, P/E ratios, and capital structure complexity, so you can identify opportunities efficiently. Pair that with the stock return calculator to model how EPS-driven valuation changes translate into actual portfolio returns. Together, these tools turn a single metric into a full analytical workflow.
Frequently asked questions
What is the difference between basic and diluted EPS?
Basic EPS uses only common shares outstanding, while diluted EPS accounts for all potential shares from options, warrants, and convertibles. For companies with complex capital structures, diluted EPS is preferred because it reflects the maximum possible share dilution.
Why are anti-dilutive securities excluded from diluted EPS?
Securities are excluded if adding them would increase EPS, as that would understate share dilution risk. In net loss periods, most dilutives become anti-dilutive and excluded, so basic and diluted EPS often match.
Can EPS calculators handle both basic and diluted calculations?
Yes, most online EPS calculators allow you to enter options and convertibles for diluted figures or stick to basic inputs, giving you flexibility depending on the complexity of the company you are analyzing.
What if my EPS calculation is different from published reports?
Double-check your data sources and ensure you include all adjustments like preferred dividends, diluted shares, and any mid-period share issuances or repurchases that affect the weighted average.
How often should I recalculate EPS for my investments?
Recalculate EPS each time new quarterly or annual financial statements are released, as earnings and share counts can shift materially from one period to the next.