
ASX sector analysis maps every ASX-listed company to one of 11 GICS sectors and uses sector indices, relative strength, and rotation signals to show which parts of the Australian market are leading or lagging. The core toolkit is straightforward: track period returns and relative strength against the S&P/ASX 200, then confirm with fundamentals before you act. Tickerplace's sector views and valuation calculators let you run that comparison in minutes.
TL;DR:
- Sector leadership on the ASX depends on relative-strength readings above or below 100, with rising values indicating outperformance and momentum.
- Cross-check sector signals with fundamental metrics like earnings revisions and valuation to avoid investing in overvalued sectors or stocks.
- Focus on longer timeframes, such as three or six months, for core allocations, and use short windows for tactical trades.
- Be cautious of sectors heavily influenced by one or two dominant stocks, especially in materials or banking, which can distort signals.
- Use valuation tools to confirm whether leading sector holdings are undervalued or overvalued before committing capital.
What Are the 11 GICS Sectors on the ASX?
The ASX adopted the Global Industry Classification Standard in 2002, aligning Australian companies with the same 11 sectors used across global markets. That matters because it means an ASX investor can compare Financials or Energy performance against US or European peers using an identical framework, not a locally invented one.
Each sector groups companies by what they actually do, and the MarketIndex sector breakdown assigns a benchmark ticker to every one:
- Financials — banks, insurers, and diversified financial firms; the largest sector by weight on the ASX.
- Materials — miners, chemical producers, and building-materials companies.
- Industrials — transport, logistics, and capital-goods businesses.
- Consumer Discretionary — retailers, media, and travel companies tied to household spending.
- Consumer Staples — supermarkets, food producers, and household-goods makers.
- Health Care — biotech, medical devices, and healthcare providers.
- Energy — oil, gas, and coal producers.
- Real Estate — property trusts and developers.
- Communication Services — telecoms and media networks.
- Information Technology — software and hardware companies.
- Utilities — electricity, gas, and water infrastructure operators.
Sector indices are typically built from S&P/ASX 200 constituents, which is why the index is the standard benchmark for sector-level comparisons. Beyond the 11 core sectors, S&P Dow Jones also runs companion indices, like the S&P/ASX 200 A-REIT, plus All Technology and Agribusiness baskets that isolate themes cutting across standard sector lines. Listcorp notes the hierarchy actually runs deeper than most investors realize, with sectors breaking into industry groups, industries, and sub-industries beneath the headline classification.
How Do You Read a Sector Performance Dashboard?
A typical sector dashboard shows the same handful of fields laid out consistently, and once you know what each one means, scanning a leaderboard takes seconds rather than minutes. Most services display period returns across 1 day, 1 week, 1 month, and year-to-date, alongside a relative-strength figure and a rotation label.
Swingfolio's end-of-day sector baskets illustrate the standard format well. Sector baskets are built using market-cap and liquidity screens similar to those governing the ASX 200 itself, which keeps thinly traded names from skewing the numbers.
Statistic Callout: A relative-strength reading around 100 means a sector is tracking the S&P/ASX 200 line for line. Anything notably above signals outperformance; anything below signals lag. That single number is the fastest gut check on a dashboard.
A few reading heuristics make the numbers usable:
- RS above 100 and rising means a sector is both outperforming and gaining momentum, the strongest combination.
- RS above 100 but falling suggests fading leadership, worth watching rather than chasing.
- RS below 100 but climbing often flags an early-stage improvement, the kind of setup contrarian investors look for.
- Never treat a strong RS reading in isolation. Single-stock concentration in mining or banking can flatter or distort a whole sector's number, so cross-check with valuation before drawing conclusions.
What's the Step-by-Step Workflow for ASX Sector Analysis?
Turning sector data into a decision takes a repeatable process, not a one-off glance at a leaderboard. Analysts who do this well tend to follow roughly the same five steps, whether they're managing a personal portfolio or a client book.
- Set your horizon and benchmark. Decide whether the S&P/ASX 200 or the All Ordinaries better represents your investable universe, then stick with it for consistency.
- Rank sectors by relative strength across multiple timeframes. Compare 1-week, 1-month, and 3-month RS side by side. A sector that's strong across all three windows is a far more reliable signal than one that spikes on a single week.
- Drill into industry-level names. Broad GICS sectors can mask divergent stories, since a GICS code covers everything from lithium miners to gold producers under one Materials umbrella. Splitting the sector into its component industries often reveals the real driver.
- Layer on fundamentals. Check earnings revisions, P/E relative to sector median and history, and balance-sheet health before treating momentum as investable.
- Apply portfolio rules. Size positions deliberately, set stop rules in advance, and use an intrinsic-value margin of safety rather than buying purely on sector strength.
Watch for red flags along the way: heavy single-stock dominance within a sector basket, upcoming index reconstitution that can shuffle weightings overnight, illiquid constituents that distort returns, and thematic baskets built on looser inclusion rules than the standard GICS indices.
Pro Tip: When a sector shows up as "leading" on a rotation chart, don't buy the sector, buy the strongest company within it. Screen the top holdings for earnings upgrades and a real intrinsic-value gap first. Momentum without improving fundamentals tends to be short-lived on the ASX.
How Tickerplace and Primary Sources Work Together
Primary sources and aggregated tools each play a different role in sector work, and knowing when to use which saves you time. Go to the ASX index pages or S&P documentation when you need the official construction rules, eligibility filters, or rebalancing schedule for a given index. Go to a valuation platform when you need to move fast across dozens of names at once.
Tickerplace updates DCF, P/E, and P/S valuation models daily for thousands of ASX and US-listed companies, so you can see at a glance whether a stock inside a hot sector is actually cheap or already priced for perfection. That distinction, between a sector that's rising and a stock within it that's still undervalued, is where most sector-rotation strategies actually make or lose money.
Two practical ways to put this to work:
- Compare a sector basket's return against the ASX 200 first, then open the full list of ASX companies by market cap to identify which constituents are driving the move.
- Run an intrinsic-value check on the top two or three holdings of a leading sector before adding exposure, rather than buying the sector index blindly.
What Matters Most When Applying This on the ASX
The biggest mistake investors make with sector analysis is treating every RS window the same way. Use short windows, a week or a month, for tactical trades, and stretch to three or six months for anything meant to shape a core allocation.
The ASX complicates this further because a handful of miners and the big four banks carry outsized index weight, so a "strong Materials sector" reading can really just mean iron ore prices moved, and commodity or currency swings routinely masquerade as sector strength. Cross-check every rotation signal against valuation and earnings momentum before you touch your actual exposures. A sector that's technically leading but fundamentally expensive is a trap, not an opportunity.
— Tickerplace
Run Your Own Sector Analysis with Tickerplace's Tools
Tickerplace is built to execute exactly the workflow this guide walks through, without needing five different browser tabs open at once. Its sector and industry views let you compare returns and relative strength across ASX sectors in one place, then move straight into individual stock valuation without switching platforms.

Start with the Stock Valuation Checker to see whether a leading sector's top holdings are overvalued or undervalued right now, and pair it with the Intrinsic Value Calculator to work out a margin of safety before you size a position. Both tools pull daily-updated data across thousands of ASX names, so the numbers you see reflect current prices, not last quarter's snapshot. If you're ranking sectors this week, open the valuation checker on your top two candidates and compare their fair-value gaps side by side.
Where to Go for Official Sector Data
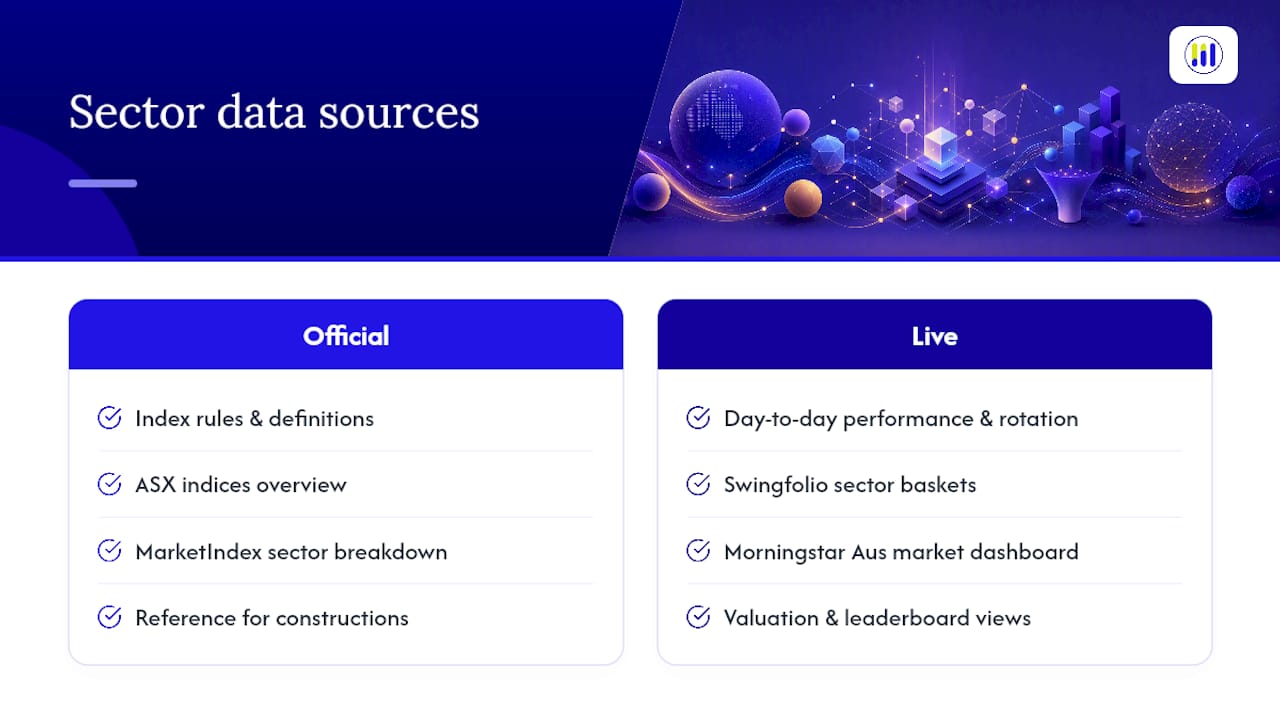
For index construction rules and official sector definitions, start with the ASX indices overview and the MarketIndex ASX sector breakdown. For live leaderboards and rotation visuals, Swingfolio's sector baskets and Morningstar's Australian market dashboard cover day-to-day performance tracking and valuation context.
This article is general information, not a substitute for advice from a qualified financial advisor. Consult a qualified financial professional about your own circumstances before acting on anything here.
Sources
FAQ
Which ASX Sectors Are Booming Right Now?
Sector leadership rotates constantly, so check a live relative-strength leaderboard rather than relying on a fixed answer; sectors with RS above 100 and rising across multiple timeframes are the ones currently outperforming the ASX 200.
What Sectors Are Expected to Outperform in 2026?
No dashboard can reliably forecast sector winners a year out. The better approach is tracking rotation signals in real time and combining them with valuation checks, since fundamentals tend to matter more than predictions once you're actually deploying capital.
What Is the Outlook for the Australian Stock Market?
Sector-level analysis, rather than a single market-wide call, gives a clearer read. Watching how Financials, Materials, and Energy trade relative to the ASX 200 tells you more about market health than any single index-level prediction.
Which Sectors Tend to Boom on the ASX?
Materials and Energy often lead during commodity upcycles, while Financials tends to dominate given its heavy weight in the index. Health Care and Information Technology have historically led during periods of falling interest rates, though sector leadership shifts with the macro cycle rather than staying fixed.
How Do I Start Analyzing ASX Sectors Myself?
Rank sectors by relative strength across a few timeframes, then use a tool like Tickerplace's stock valuation checker to confirm whether the leading sector's top names are still reasonably priced before adding exposure.